
Figure 7.
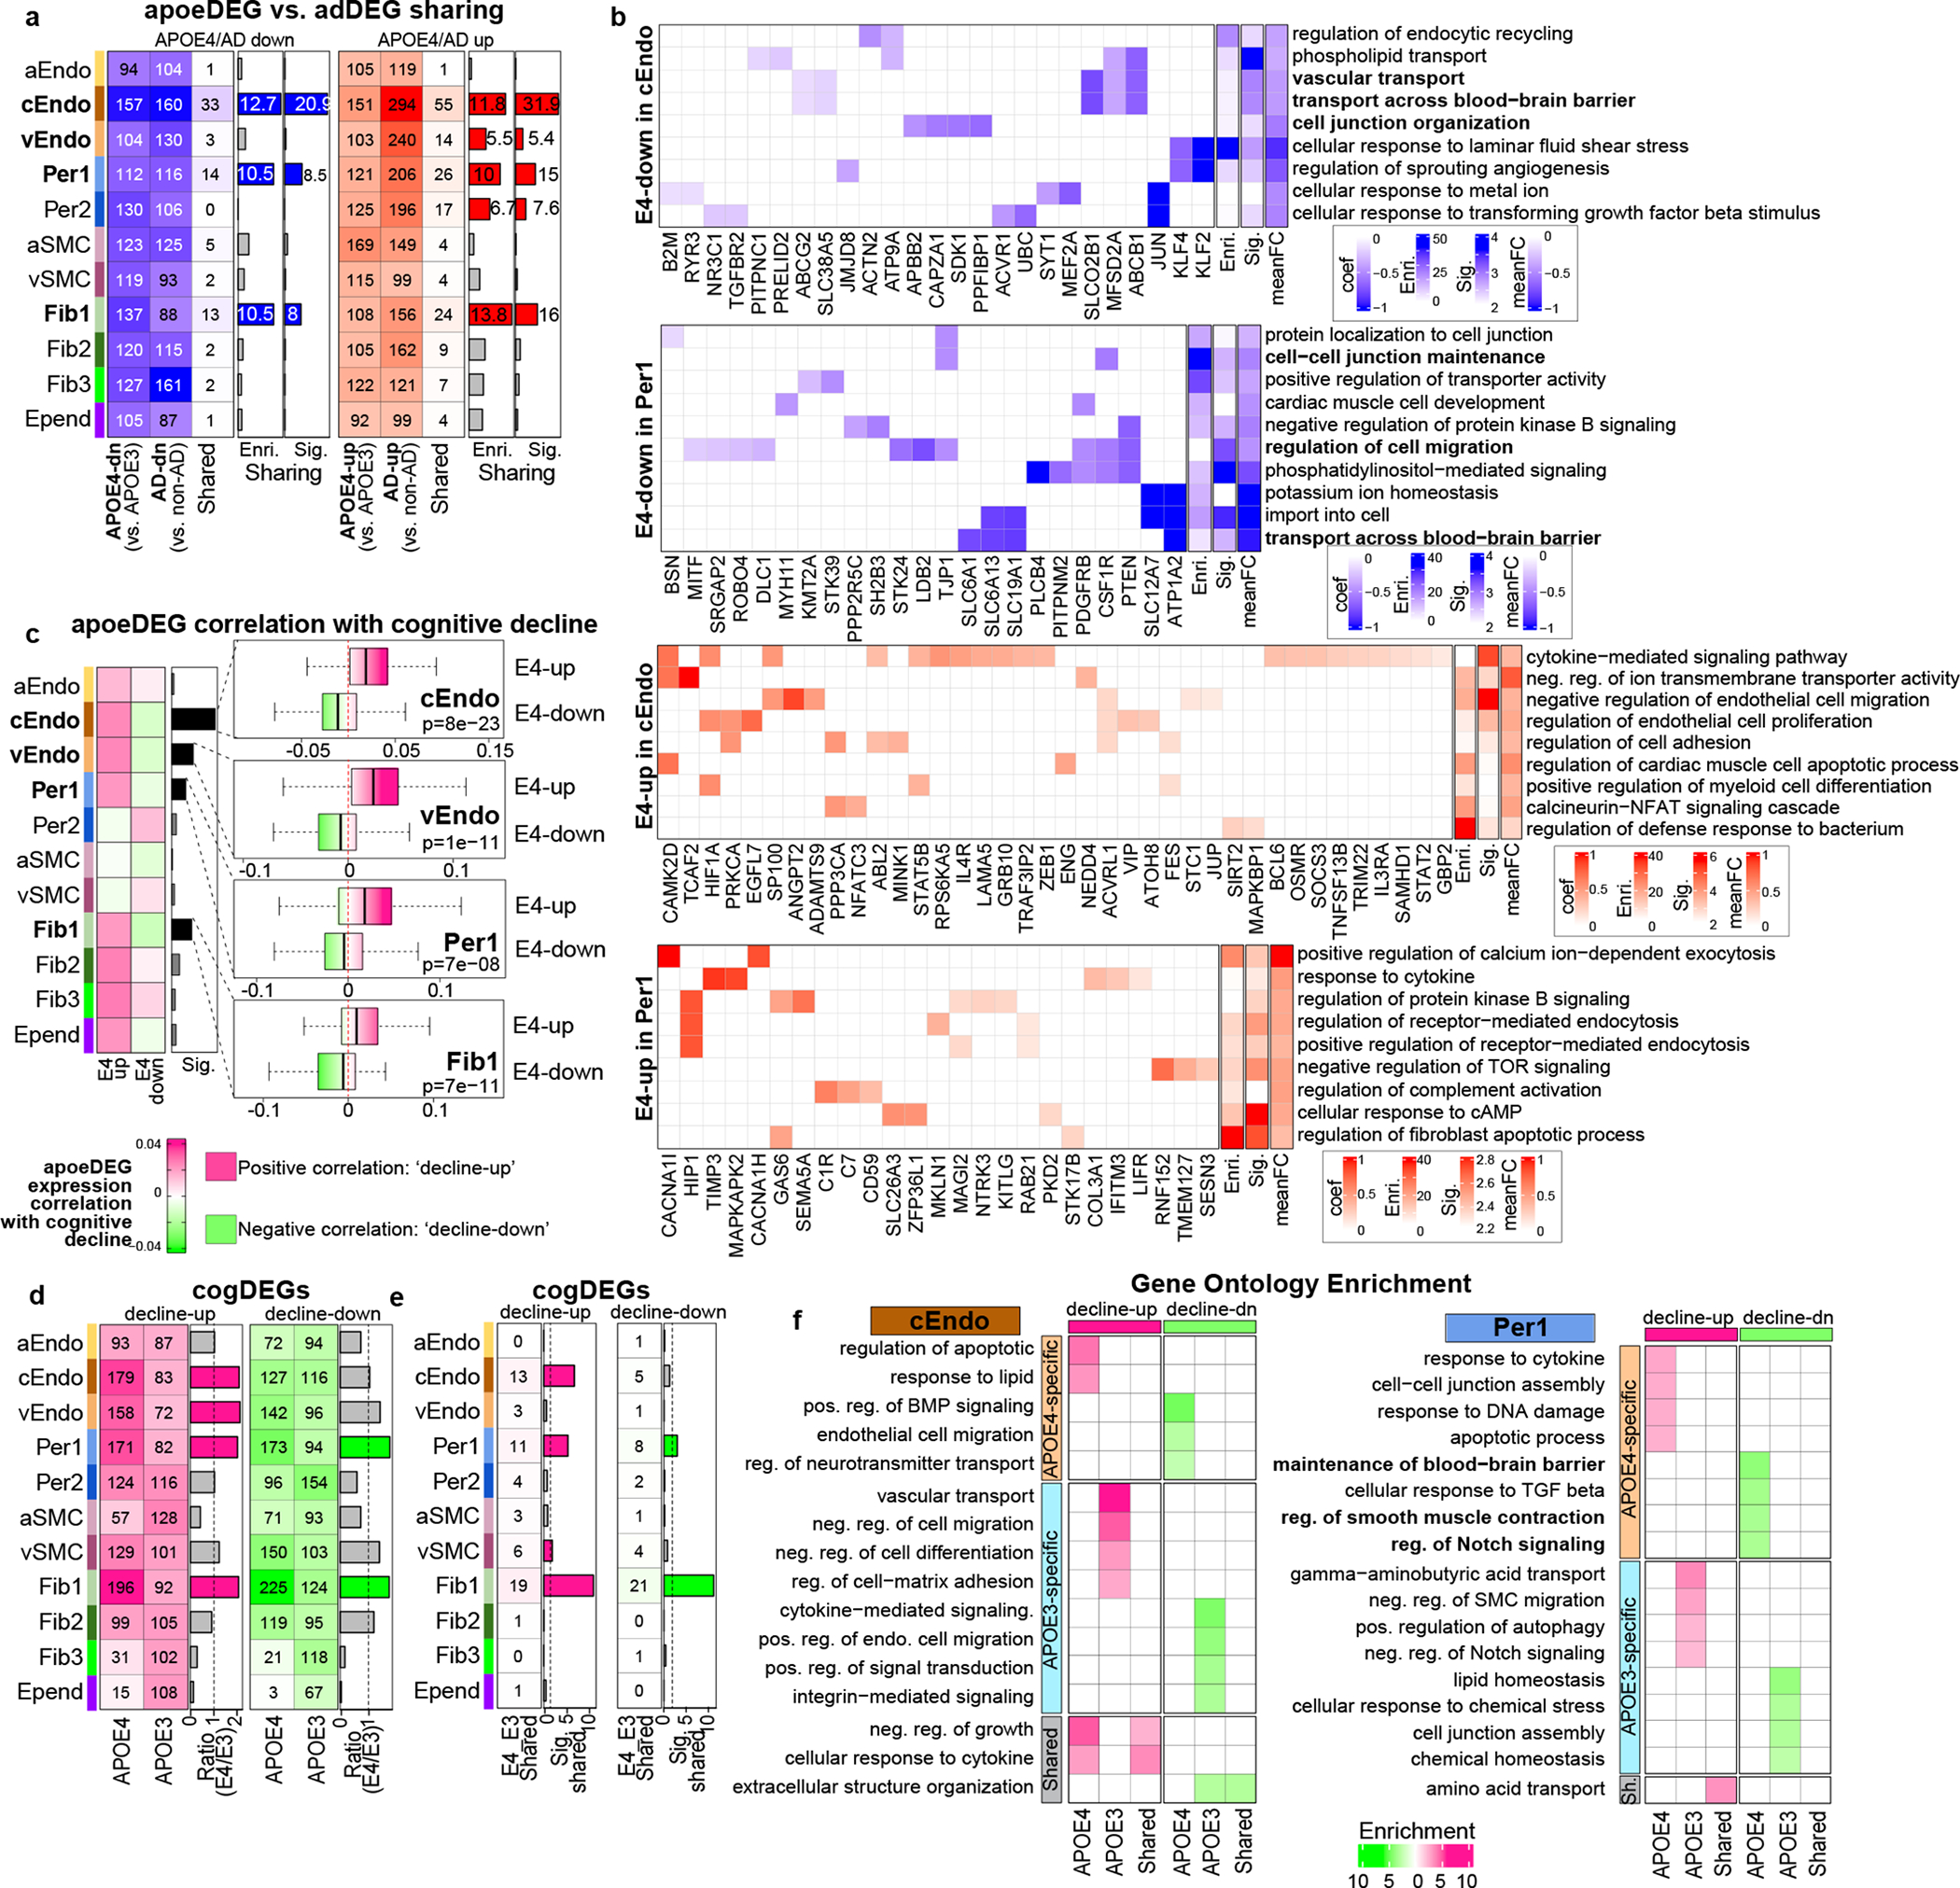
APOE4-associated transcriptional changes and cognitive decline. a. The comparison of apoeDEGs and adDEGs for each cell type. The heatmaps show the number of up- and downregulated apoeDEGs, adDEGs and overlapping DEGs in APOE4 or AD groups. The fold enrichment and adjusted p-value (Fisher’s exact test, < 0.05 as cutoff, two-sided) are shown in the barplot. b. Enriched Gene Ontology biological processes in apoeDEGs in cEndo and Per1. Enrichr was used (proportion test, adjusted p-value < 0.05 as cutoff). The color of the heatmap for each term-gene pair represents the effect size. The last three columns show enrichment, significance of each term, and average effect size of the genes. The representative terms are bolded. c. The difference of correlation of apoeDEGs with cognitive decline between up- and down-regulated apoeDEGs in the APOE4 group. The correlation between apoeDEGs and cognitive decline was calculated. The heatmap shows the average correlation. The barplot shows the significance of higher correlation of apoeDEGs with cognitive decline.The boxplot (right) shows the distribution of correlation with cognitive decline in E4-up and E4-down genes n=428 individuals. The box starts in the first quantile (25%) and ends in the third (75%). The line inside represents the median. Two whiskers represent the maximum and minimum without outliers. T-test is used (adjusted p-value < 0.05 as cutoff). P-value is shown. d. The number of decline-up genes (left) and decline-down genes (right) in APOE4 and APOE3 individuals. The bar plot showed the ratio of cogDEGs in E4 vs. E3 in various cell types with a ratio of >1.5 fold as a cutoff. e. The number and significance of overlapping decline-up/-down regulated genes between APOE4 and APOE3