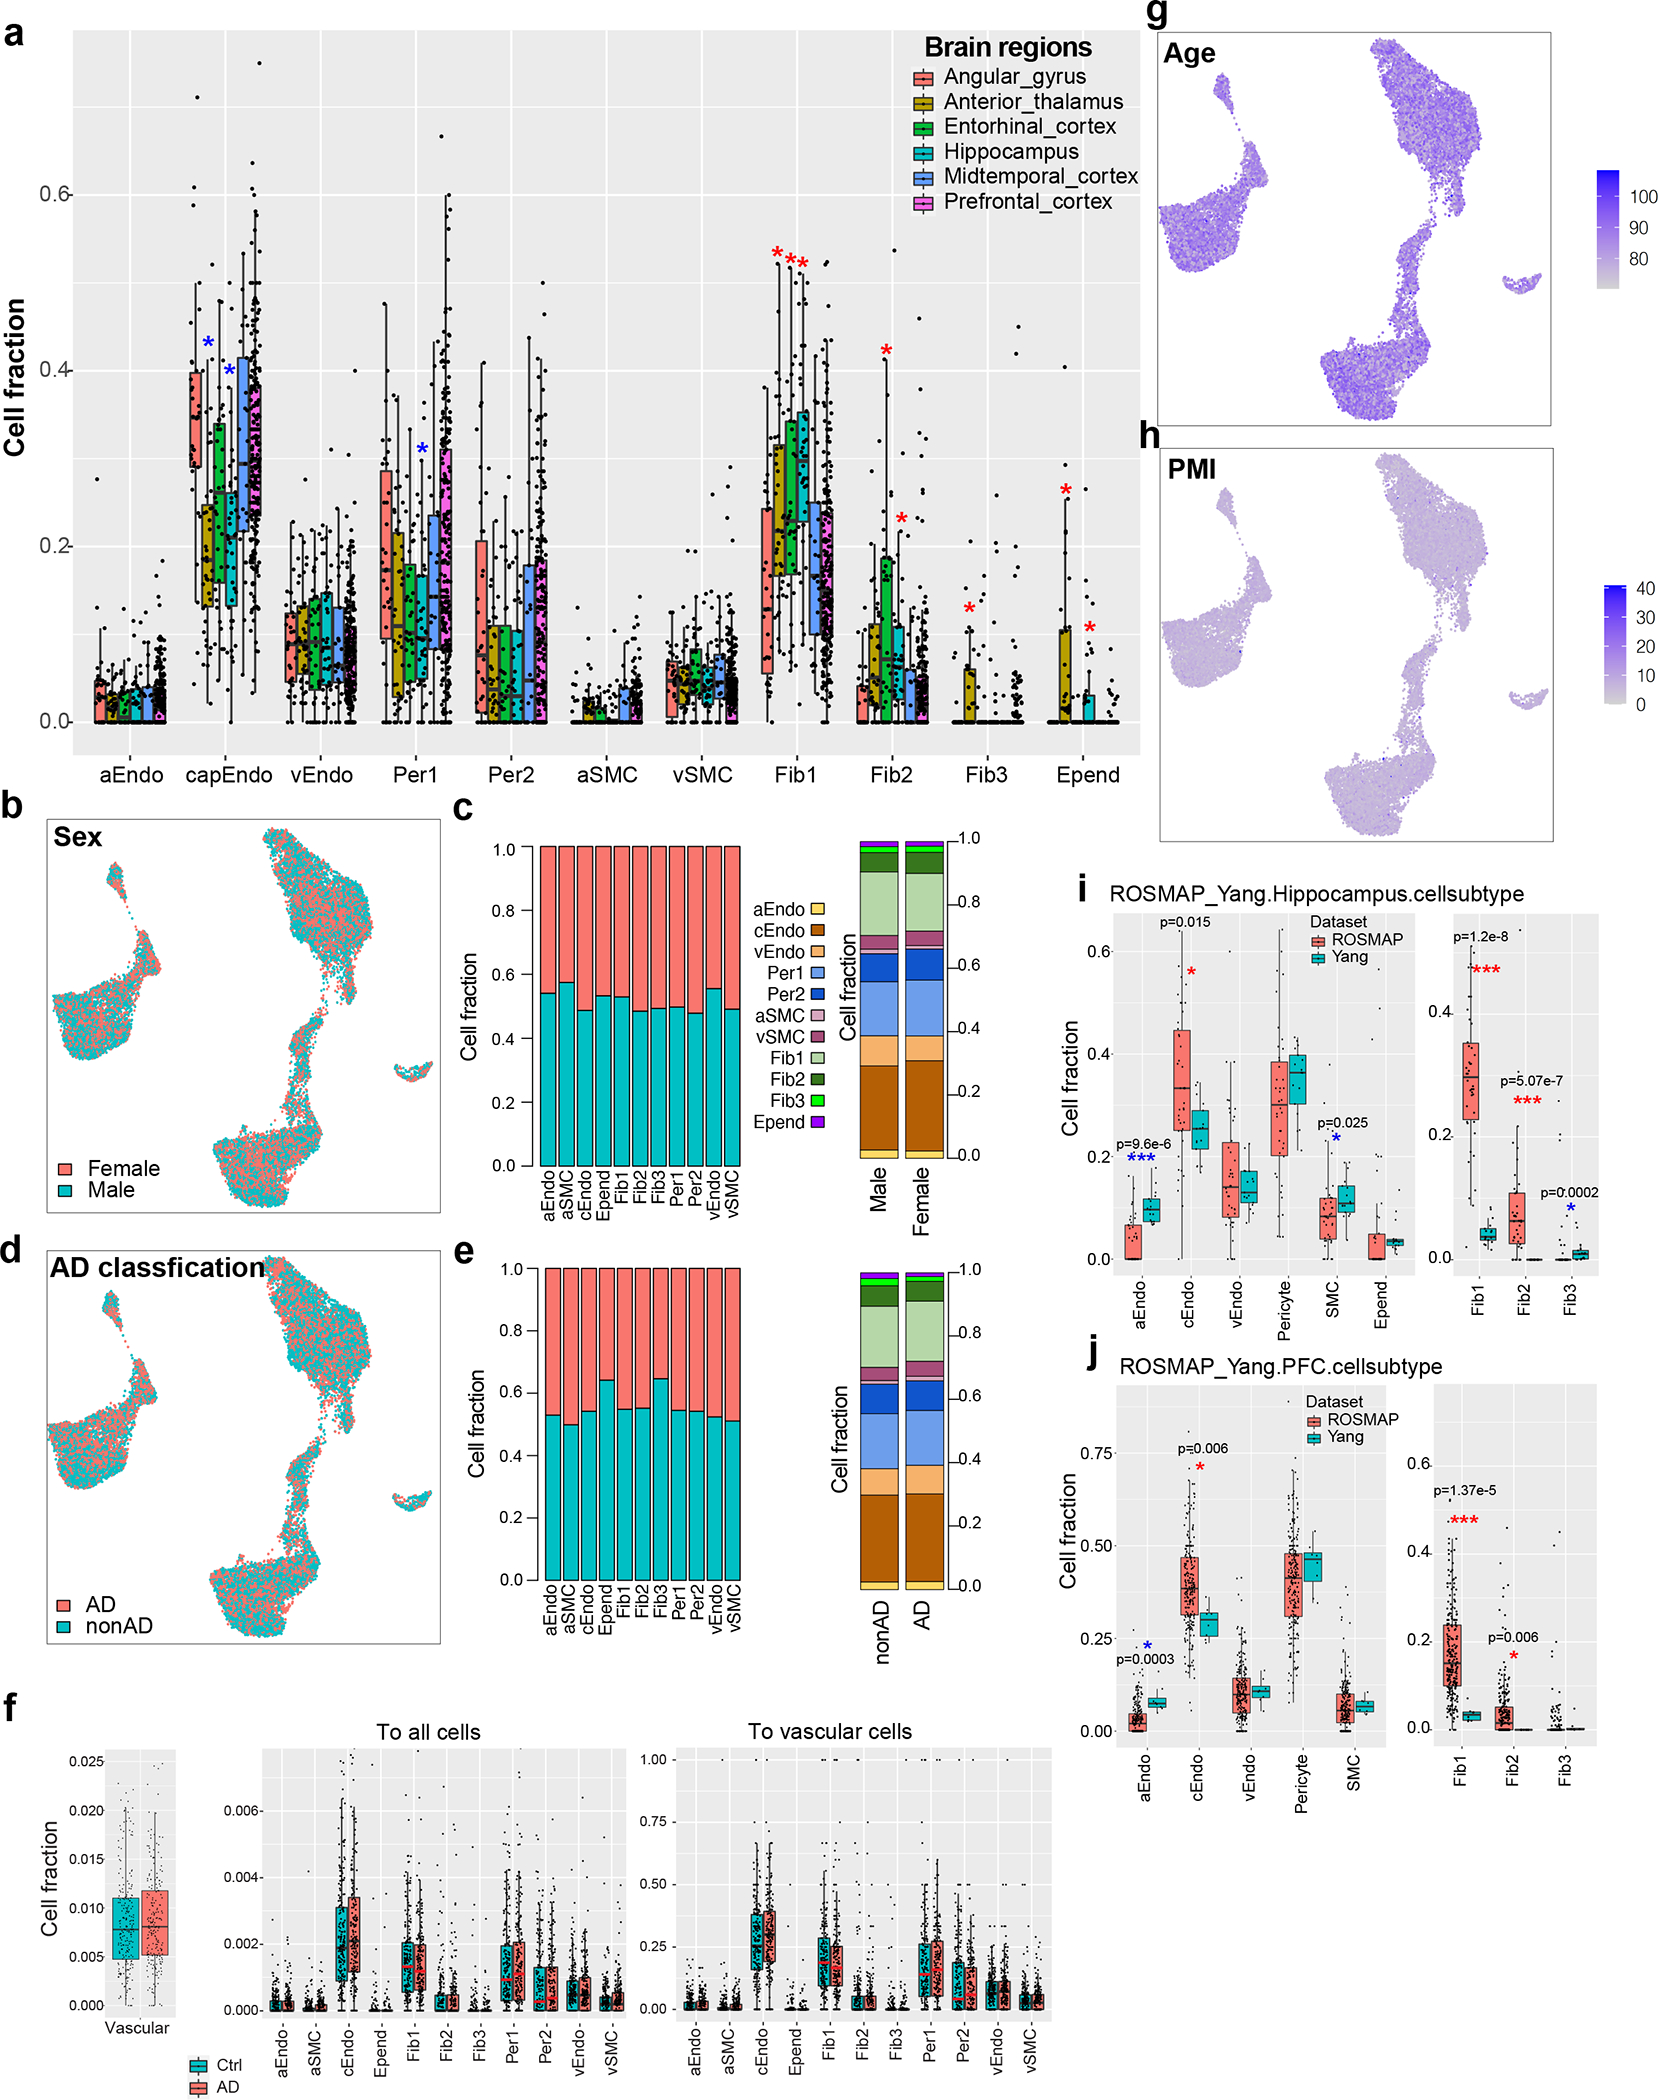
Extended Data Figure 2. Cell fraction analysis.

a. Distribution of cell fraction across six brain regions in cell subtypes. The stars represent the significance of cell types enriched(red star) or depleted(blue star) in specific regions compared to the overall fraction by the Wilcoxon rank test adjusted p-value < 0.05, n=409 in PFC; 47 in angular gyrus, mid-temporal cortex and thalamus; 45 in entorhinal cortex; 84 in hippocampus. The box starts in the first quantile (25%) and ends in the third (75%). The line inside represents the median. Two whiskers represent the maximum and minimum without outliers. b-c. Cerebrovascular cell distribution by sex. b. UMAP of brain vascular nuclei colored by sex. c. Cell fraction across sex for each cell type (left) and across cell types for male and female individuals (right). d-e. Cerebrovascular cell distribution by AD classification. d. UMAP of brain vascular nuclei colored by AD classification. e. cell fraction across AD classification for each cell type (left) and across cell types for AD and control individuals (right). f. Cell fraction distribution between control and AD individuals in overall vascular cells (left) and each cell type (middle: in all cells; right: in vascular cells) (n=220 for AD and n=208 for nonAD). The box starts in the first quantile (25%) and ends in the third (75%). The line inside represents the median. Two whiskers represent the maximum and minimum without outliers. g-h. UMAP of brain vascular nuclei colored by age (g) and PMI (h) showing no difference of cell distribution with age or PMI. i-j. Comparison of cell fraction between this study (labeled “ROSMAP”) and Yang et al. in hippocampus (i) and prefrontal cortex (j). Stars represent the statistical significance by the Wilcoxon rank test (*: adjusted p-value < 0.05 ***: adjusted p-value < 0.001). Blue stars indicate a higher fraction in Yang et al. and red stars represent a higher fraction in this study. For hippocampus, n=42 for ROSMAP data, n=17 for Yang et al. data; for PFC, n=233 for ROSMAP data, n=8 for Yang et al. data. The box starts in the first quantile (25%) and ends in the third (75%). The line inside represents the median. Two whiskers represent the maximum and minimum without outliers.
