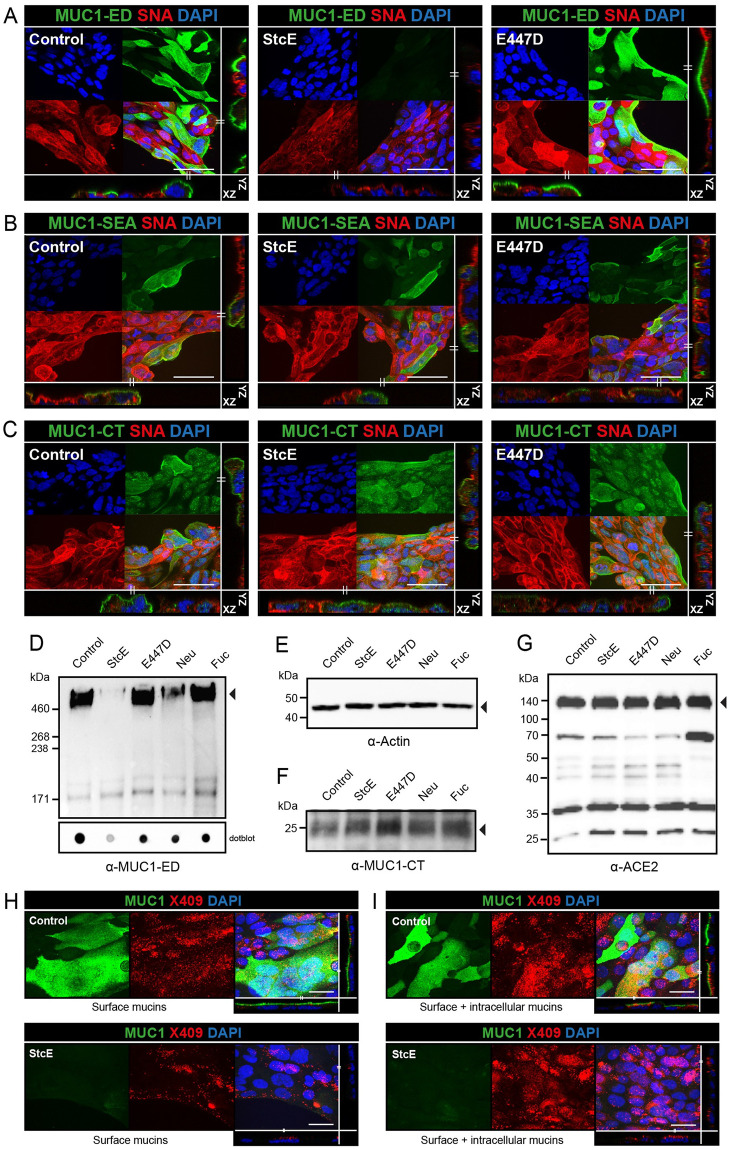
Fig 2. StcE specifically cleaves the glycosylated MUC1 ED and does not affect ACE2 expression.
(A) Immunofluorescence confocal microscopy images showing Calu-3 cells treated with StcE or E447D stained for the glycosylated part of the MUC1 extracellular domain (214D4, green) and α-2,6-linked sialic acids (SNA, red). Complete loss of 214D4 signal was observed after treatment with StcE. (B,C) Immunofluorescence confocal microscopy images of Calu-3 cells as above stained for the MUC1 SEA domain (α-MUC1-SEA antibody 232A1, green) or cytoplasmic tail of MUC1 (α-MUC1-CT antibody CT2, green) in combination with α-2,6-linked sialic acids (SNA, red). The SEA domain and CT were not affected by StcE treatment. Nuclei were stained with DAPI (blue). White scale bars represent 20 μm. Western blot and dotblot analysis of 7-day grown Calu-3 cells incubated with indicated enzymes for 3 h at 37°C stained with α-MUC1-ED antibody 214D4 (D), β-actin loading control (E), the MUC1 cytoplasmic tail with α-MUC1 CT antibody CT2 (F), and ACE2 (G). StcE treatment removes the MUC1 ED but does not affect the MUC1 CT or ACE2 receptor. (H) Immunofluorescence confocal microscopy images showing Calu-3 cells treated with StcE stained for the glycosylated part of the MUC1 extracellular domain (214D4, green) and fluorescently labelled mucin binding domain derived from StcE (X409-GFP) (X409, red). More continuous surface staining for MUC1 ED and limited punctate staining with X409 on the non-permeabilized cells Calu-3 cells. The MUC1 signal was completely removed after StcE treatment, while some staining remained for X409. (I) Immunofluorescence confocal microscopy images showing, a comparable result with a higher level of remaining X409 signal with permeabilized cells. White scale bars represent 20 μm.

