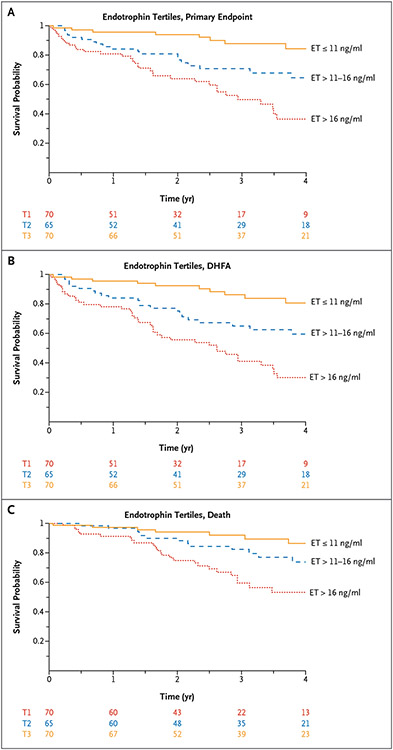
Figure 2. Kaplan–Meier Survival Curves in the TOPCAT trial.
Kaplan–Meier survival curves for tertiles of plasma endotrophin (ET) for (Panel A) the primary end point, (Panel B) all-cause death or heart failure–related hospital admission (DHFA), and (Panel C) all-cause death in the Treatment of Preserved Cardiac Function HF with an Aldosterone Antagonist trial.

