. 2023 Aug 11;12:e85647. doi: 10.7554/eLife.85647

Figure 6. Immature monocytes egress from the bone marrow (BM) independently of CCR2.

(A, B) C57BL/6 mice (n = 4, black triangles) or Ccr2RFP/RFP mice (n = 6, red squares) were treated topically six times with R848. (A) Blood counts for total monocytes, Ly6C-high and Ly6C-low monocytes at 24 hr after each treatment are shown. (B) Fold change of monocyte subpopulations versus baseline after 6× R848 treatments. (C) C57BL/6 mice or Ccr2RFP/RFP mice were either naive (WT n = 4, Ccr2RFP/RFP n = 4, grey bars) or received six R848 treatments (WT n = 4, Ccr2RFP/RFP n = 4, red bars). Immunofluorescent staining for CD68 (green) and nuclei (grey) was performed on tissue sections from lung and kidneys. Staining was quantified as mean CD68+ cells per field. Data representative of two (C) or four (A, B) independent experiments. Time-course experiments analysed using two-way ANOVA with Tukey’s multiple-comparison test to compare between time points (A); for a single time point one-way ANOVA with Bonferroni’s multiple-comparison test for >2 groups (B, C). Data are the mean ± SEM; only significant p-values are indicated; *p<0.05, **p<0.01, ***p<0.001, ****p<0.0001.

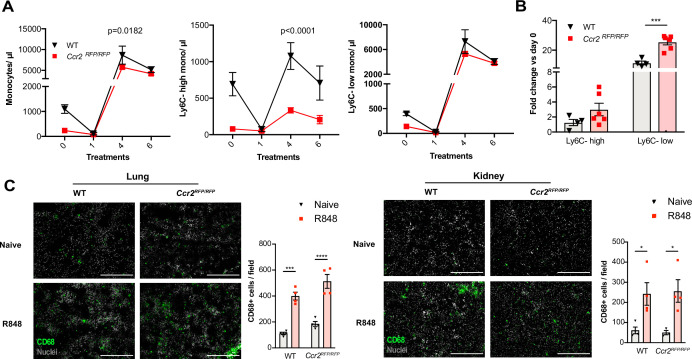
Figure 6—source data 1. FACS raw data.

Figure 6.

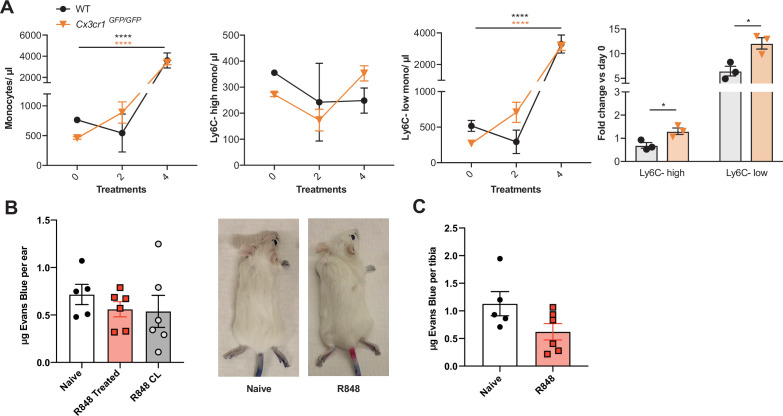
Figure 6—figure supplement 1. R848-induced myeloid response is independent from CX3CR1 and vascular permeability.

Figure 6—figure supplement 1.

(A) C57BL/6 mice (n = 3, black lines) or Cx3cr1GFP/GFP (n = 3, orange lines) were treated topically four times with R848. Blood counts for total monocytes, Ly6C-high monocytes, Ly6C-low monocytes, and the fold change of monocyte subpopulations after four treatments versus baseline. (B, C) BALB/c mice were naive (n = 5) or treated topically four times with R848 (n = 6). 1 mg Evans Blue was injected intravenously (IV) at 24 hr after the final R848 treatment. (B) Quantity of Evans Blue per ear is shown for naive mice (white bars), the R848-treated ear (red bars), and the contralateral ear (grey bars), along with representative photographs. (C) Evans Blue is quantified as µg per tibia in naïve and R848-treated mice. Data representative of two independent experiments. Time-course experiments analysed using two-way ANOVA with Tukey’s multiple-comparison test to compare between time points (A); fold change data analysed using unpaired t-test (A); two groups at a single time point compared using unpaired t-test (C); one-way ANOVA with Bonferroni’s multiple-comparison test for >2 groups at a single time point (B). Data are the mean ± SEM; only significant p-values are indicated; *p<0.05, ****p<0.0001.