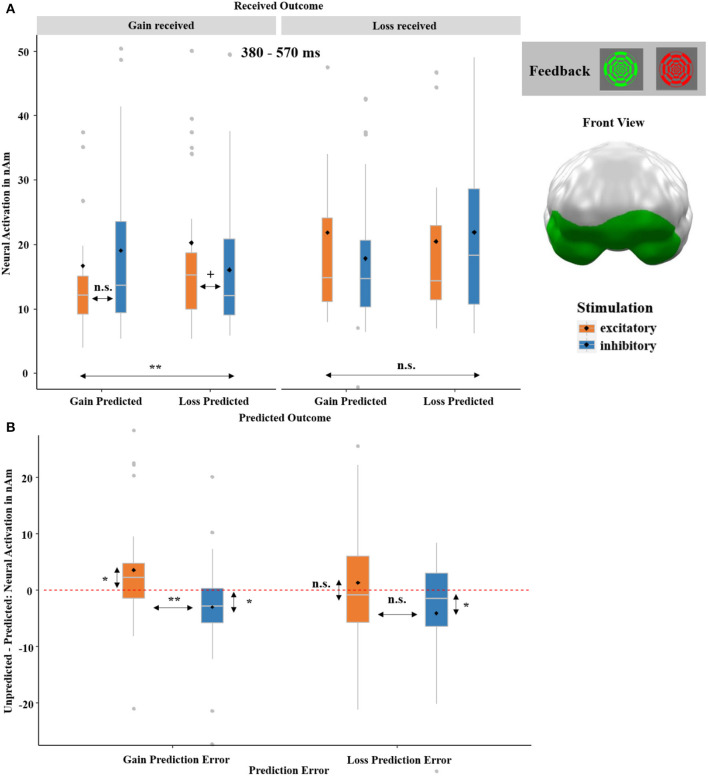
Figure 10.
(A) Significant spatio-temporal cluster featuring a significant three-way interaction of RECEIVED OUTCOME (gain received and loss received)-by-PREDICTED OUTCOME (gain predicted, loss predicted)-by-STIMULATION (excitatory, inhibitory) on feedback-locked neural responses. (B) The three-way interaction was further separated into a gain and a loss prediction error (RPE). The gain +RPE was calculated, by subtracting the neural activation of trials in which a gain was predicted and a gain was received from the neural activation of trials in which a loss was predicted, but a gain was received (i.e., unpredicted minus predicted gain outcome). The loss -RPE was likewise calculated, by subtracting the neural activation of trials with predicted losses from the neural activation of trials with unpredicted losses (i.e., unpredicted minus predicted loss outcome). A significant difference with relatively increased neural activation for unpredicted compared to predicted outcomes was especially observed for gain +RPEs (i.e., unpredicted minus predicted gain outcome) after excitatory compared to after inhibitory tDCS, indicating relatively enhanced learning adjustments after excitatory stimulation. Individual RPEs can be compared to zero, here visualized via a red dashed horizontal line, representing identical processing of unpredicted and predicted outcomes. Topographies of effects observed in L2-MNE were projected on standard 3D brain models for visualization. Boxplots indicate means (black dot), medians (gray line), and lower and upper quartiles. Asterisks indicate significance levels: + <0.1, * <0.05, ** <0.01, *** <0.001.

