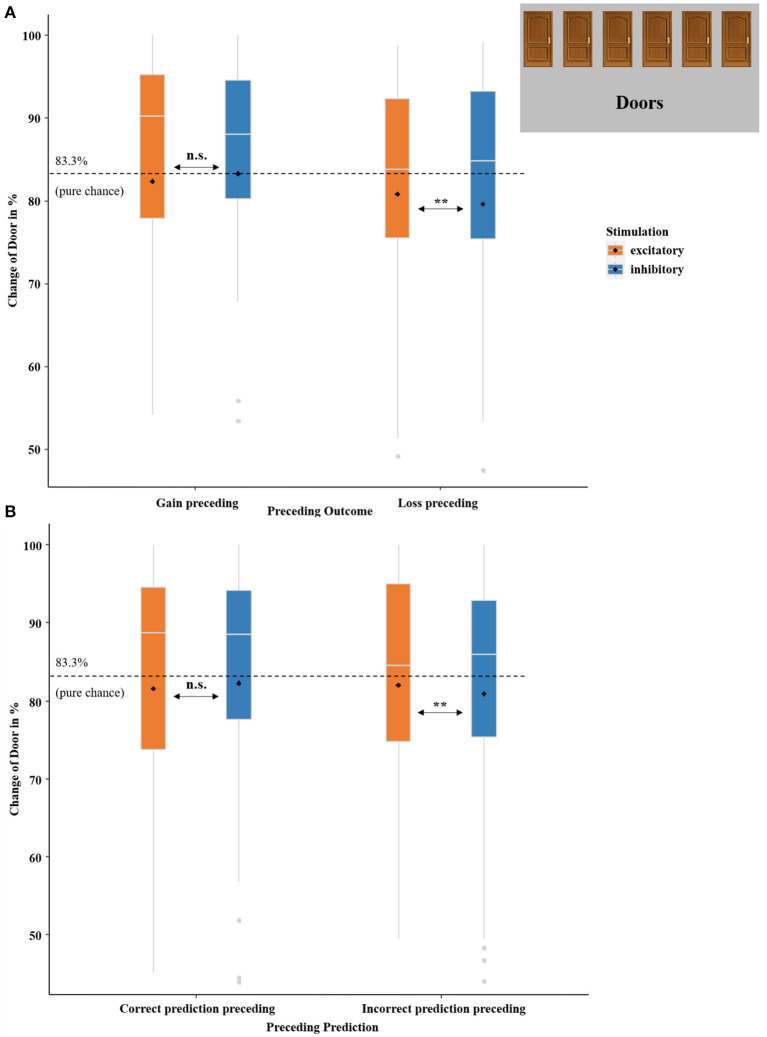
Figure 11.
Change of door in percent. (A) Boxplots indicate the probability of a change in the choice of door compared to the preceding trial in dependency of PRECEDING OUTCOME (gain preceding and loss preceding) and STIMULATION (excitatory and inhibitory). (B) Boxplots indicate the probability of a change in the choice of door compared to the preceding trial in dependency of PRECEDING PREDICTION (correct prediction preceding and incorrect prediction preceding) and STIMULATION (excitatory and inhibitory). The dashed black lines indicate pure chance (83.3%) that a change of door selection occurs. Boxplots indicate means (black dot), medians (gray line), and lower and upper quartiles. Asterisks indicate significance levels: + <0.1, * <0.05, ** <0.01, *** <0.001.

