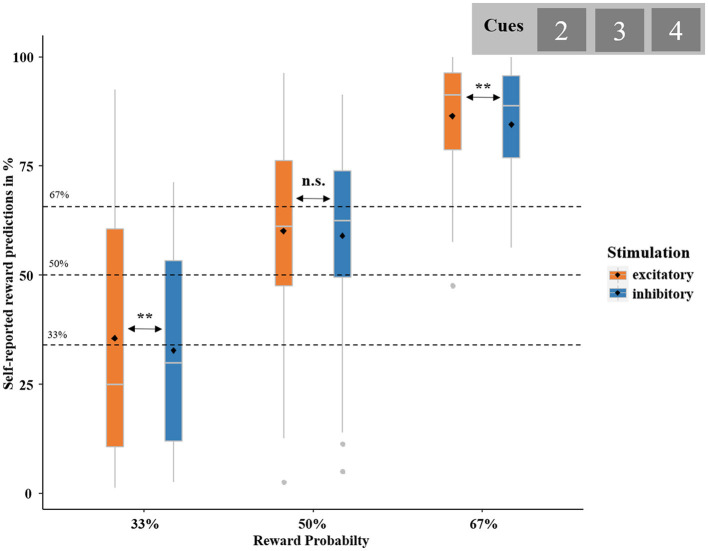
Figure 4.
Self-reported reward predictions in percent. Boxplots represent the probability of expecting to receive a reward, calculated based on participants' self-report at the end of each trial (“Did you expect this outcome?”). Self-reported reward predictions are broken down by actual REWARD PROBABILITY (i.e., 33, 50, and 67%; dashed black lines)—as indicated by cue value (“2,” “3,” and “4”)—and STIMULATION (excitatory and inhibitory). Boxplots indicate means (black dot), medians (gray line), and lower and upper quartiles. Asterisks indicate significance levels: + <0.1, * <0.05, ** <0.01, *** <0.001.

