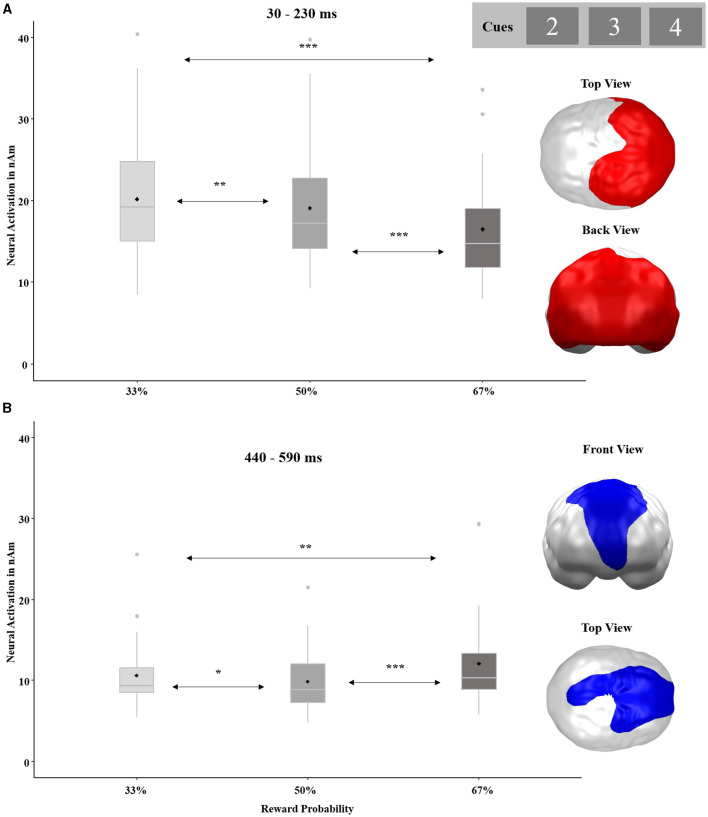
Figure 6.
Significant spatio-temporal clusters featuring a main effect for REWARD PROBABILITY (33, 50, and 67%) on cue-locked neural responses. (A) Posterior brain regions with decreasing neural activations in response to increasing reward probability. (B) Frontoparietal brain regions with strongest neural activations in response to the highest reward probability. Topographies of effects observed in L2-MNE were projected on standard 3D brain models for visualization. Boxplots indicate means (black dot), medians (gray line), and lower and upper quartiles. Asterisks indicate significance levels: + <0.1, * <0.05, ** <0.01, *** <0.001.

