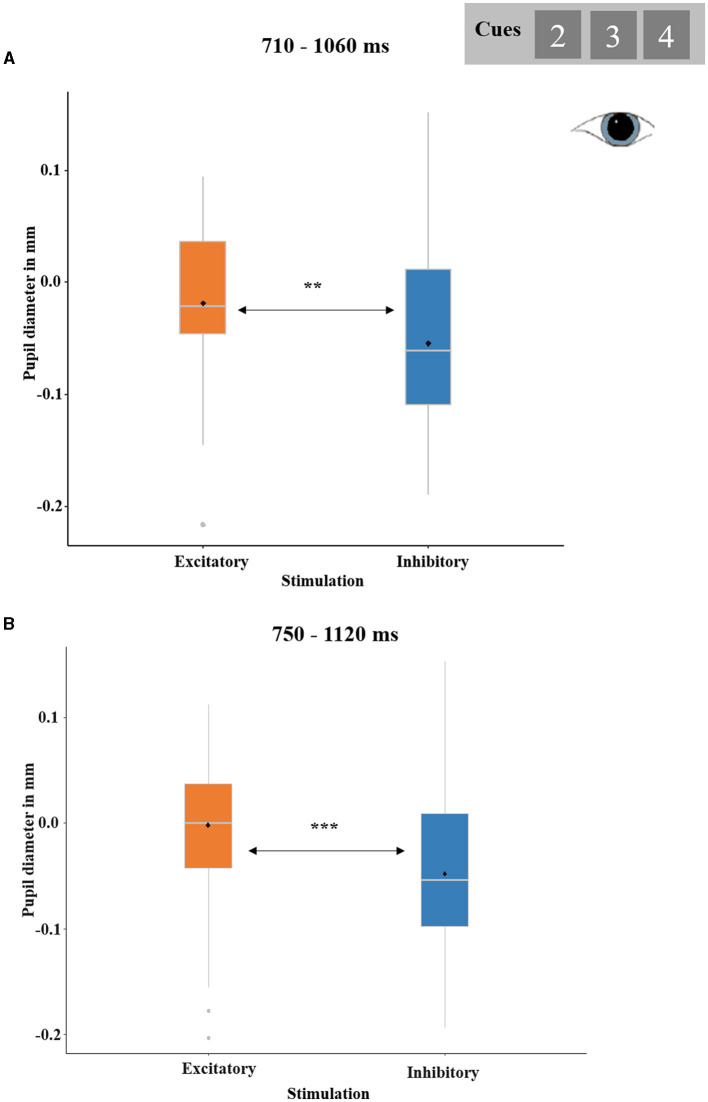
Figure 7.
Significant effect of STIMULATION (excitatory and inhibitory) on cue-locked pupil responses. (A) Temporal cluster showing relative pupil dilations after excitatory compared to inhibitory stimulation in the analysis REWARD PROBABILITY (33, 50, and 67%) by STIMULATION. The depicted pupil diameters were baseline-adjusted (enabling negative values). Boxplots indicate means (black dot), medians (gray line), and lower and upper quartiles. (B) Temporal cluster showing relative pupil dilations after excitatory compared to inhibitory stimulation in the analysis PREDICTED OUTCOME (gain predicted, loss predicted) by STIMULATION.

