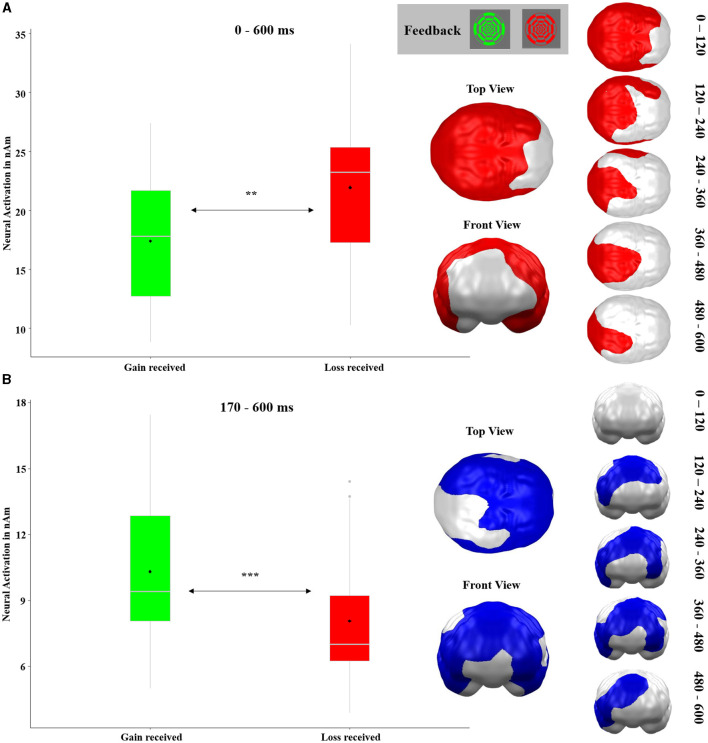
Figure 9.
Significant spatio-temporal clusters featuring main effects of RECEIVED OUTCOME (gain received and loss received) on feedback-locked neural responses as revealed by t-test. (A) Posterior brain region with stronger neural responses to losses as compared to gains. (B) Frontal, temporal, parietal, and left occipital brain regions with greater activations in response to gains compared to losses. This cluster was originally constituted of two clusters. For the original clusters and their development across time, see Supplementary material 1.2. Graphics show the maximal temporal and spatial extent of each cluster. Because some brain regions show temporally changing shifts of activity (loss>gain or gain>loss), some areas appear in both clusters. Topographies of effects observed in L2-MNE were projected on standard 3D brain models for visualization. Boxplots indicate means (black dot), medians (gray line), and lower and upper quartiles.

