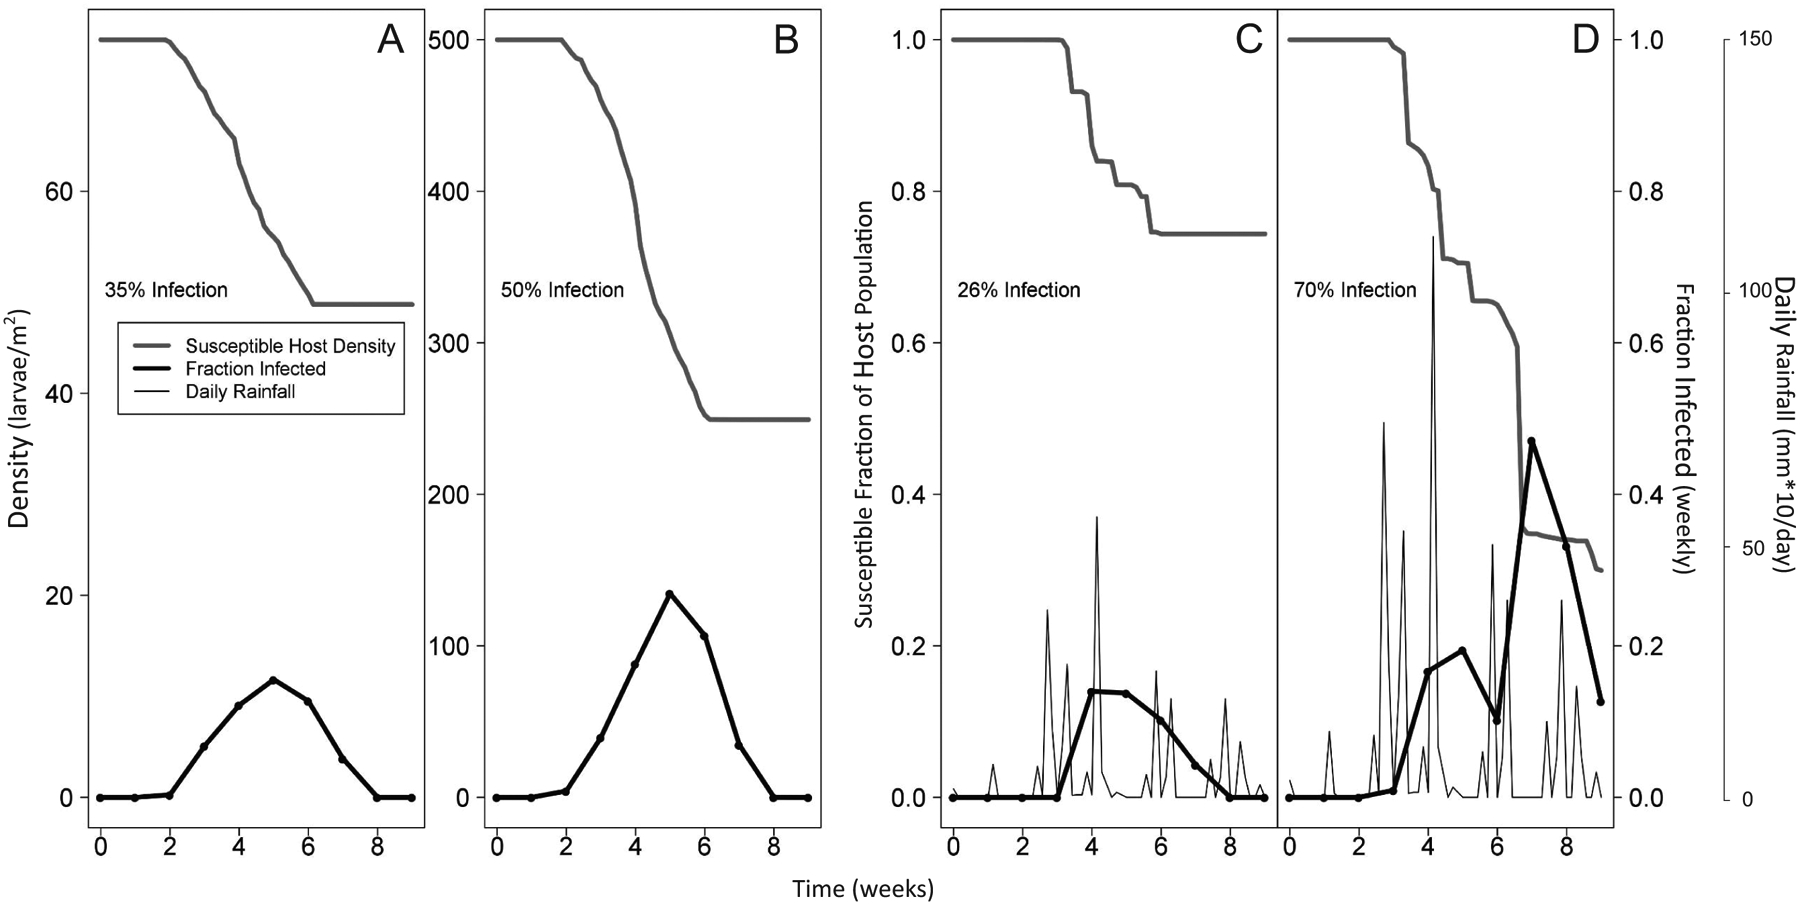
Figure 2:

Single realizations of the density-dependence-only model (A, B) and the weather-only model (C, D). In A the initial host density is 75 larvae per square meter, while in B the initial host density is 500 larvae per square meter. C and D have the same temporal distribution of rainfall events, but in D the volume of rain is twice as high as in C. Percent infection values indicate cumulative infection over the entire epizootic.
