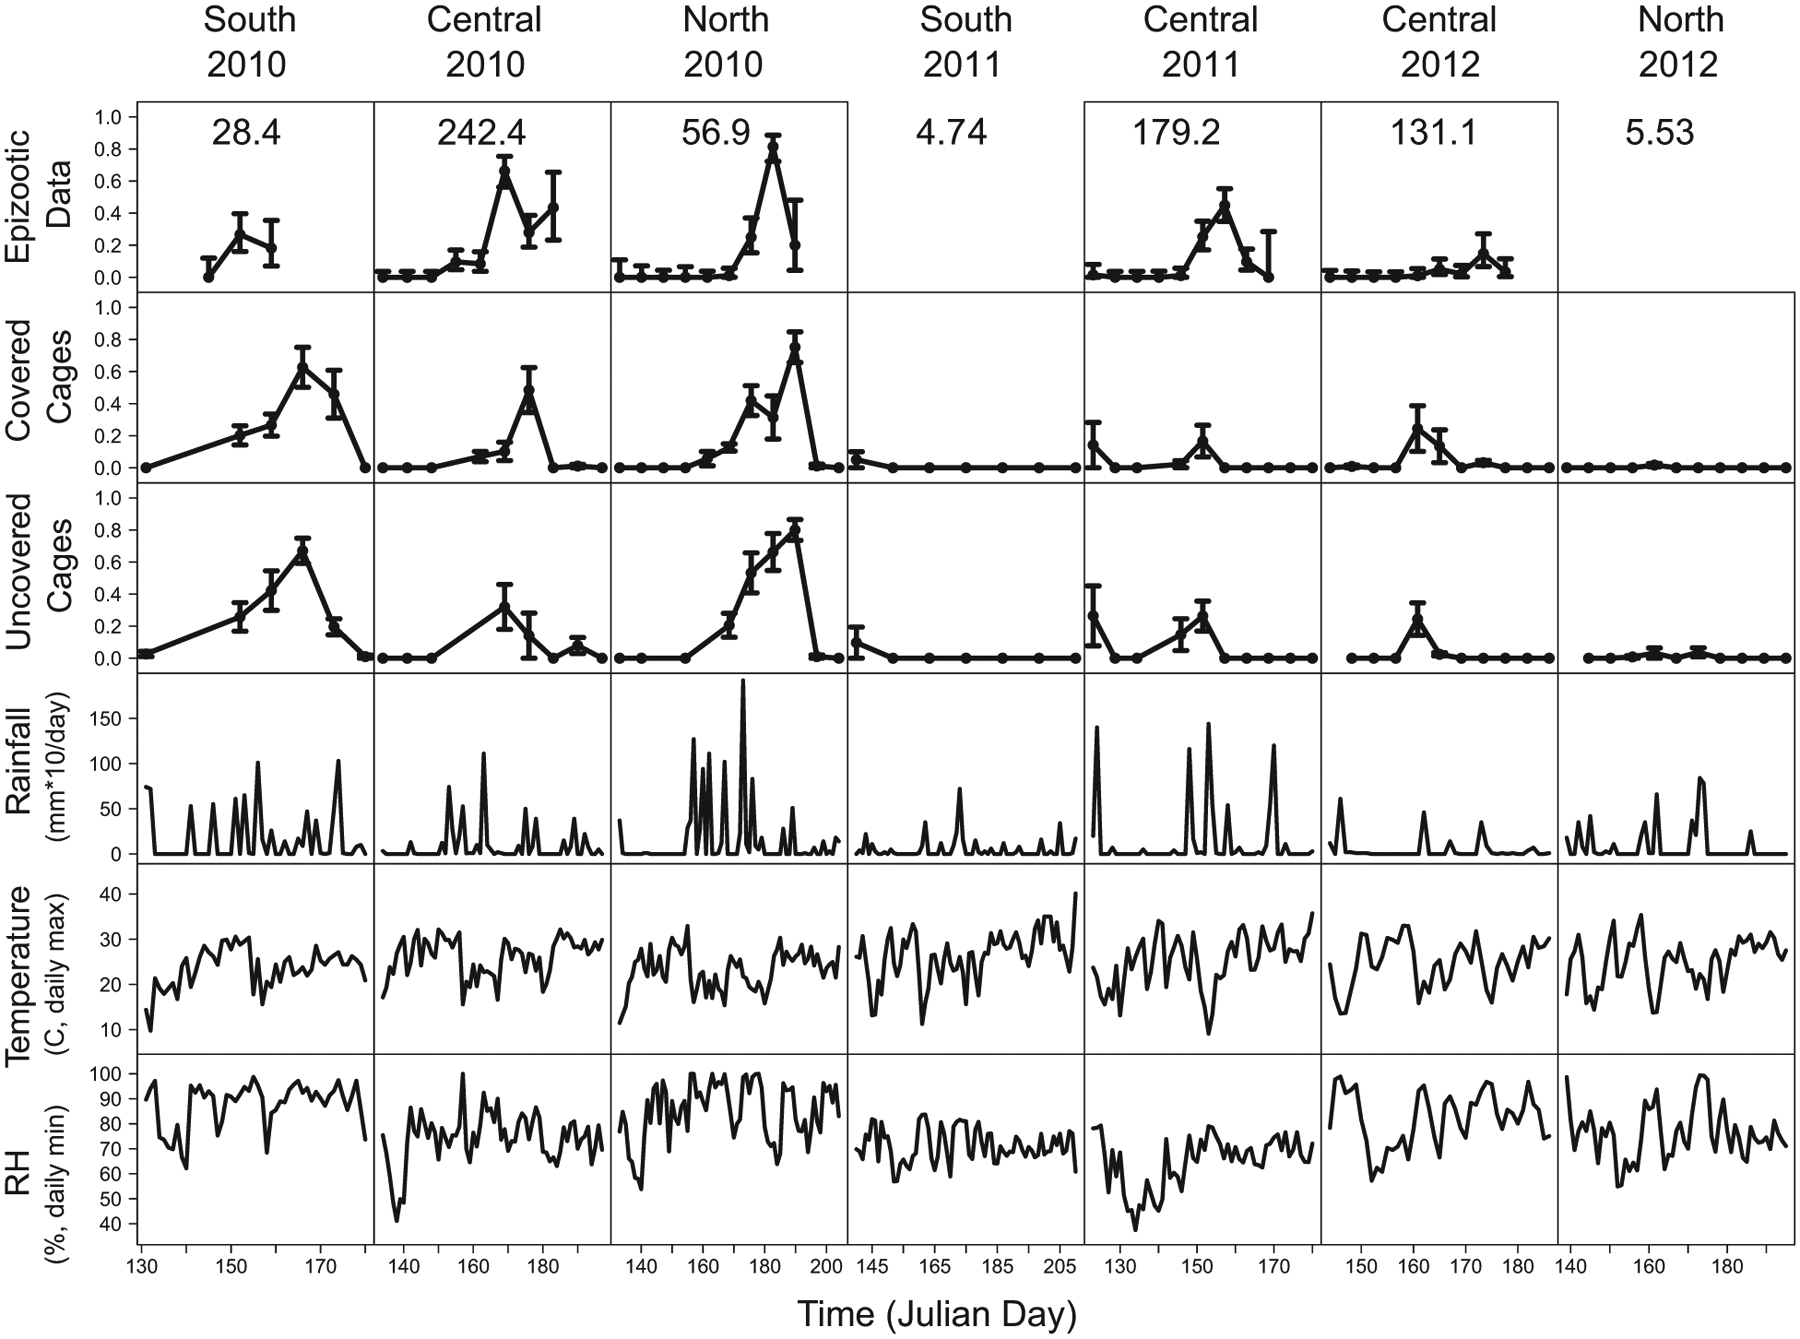
Figure 5:

Observational and experimental data on Entomophaga maimaiga infection rates, together with weather data in each population, for each year of our study. Error bars represent 1 SEM. The values in the top row show the initial host density S(0) for each site in units of larvae per square meter. “Covered Cages” refers to an experimental treatment in which plastic boxes were placed over cages to limit exposure to conidia, while “Uncovered Cages” refers to an experimental treatment that had no boxes. Box effects were modest, and therefore we do not consider them further (see the appendix). The data in this figure have been deposited in the Dryad Digital Repository (https://doi.org/10.5061/dryad.3nv3ss2; Kyle et al. 2020).
