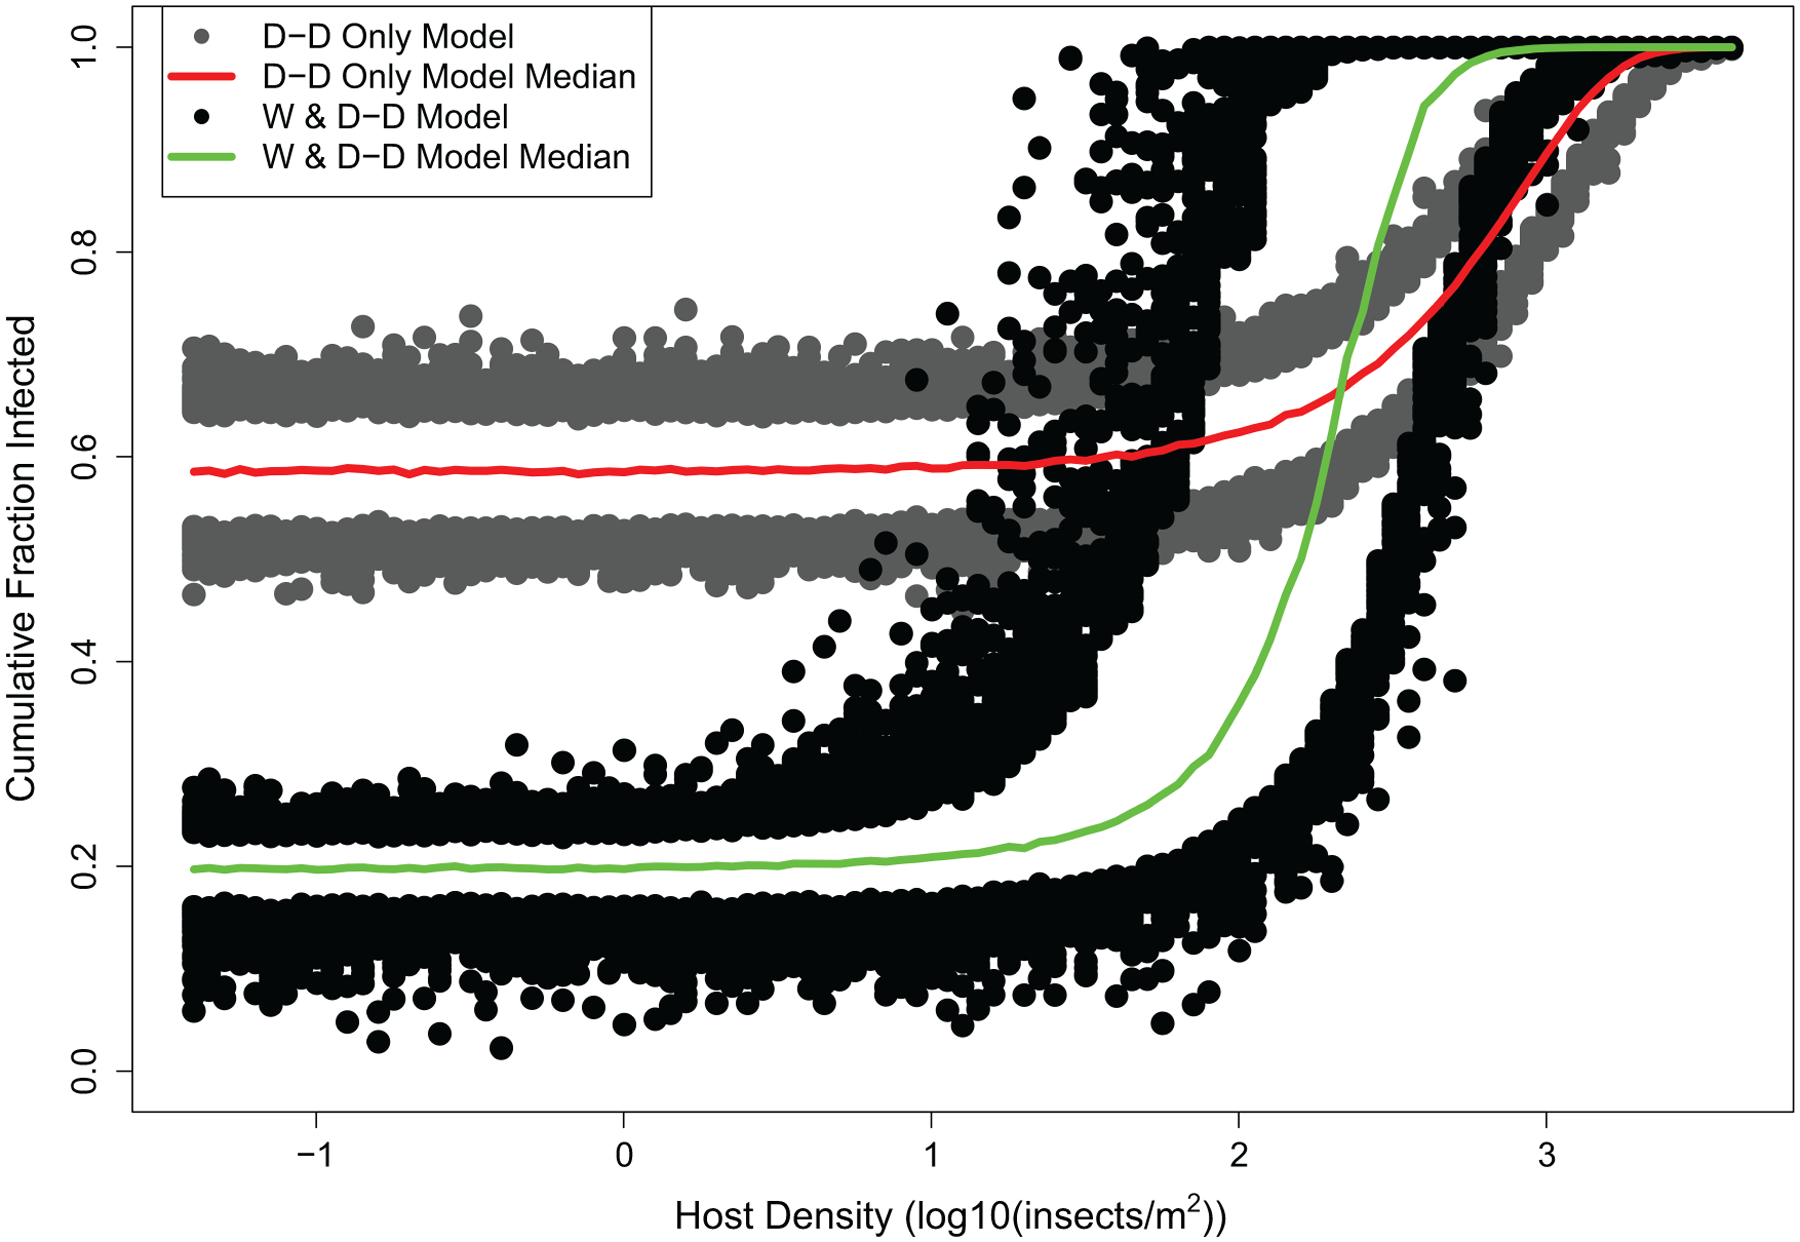
Figure 7:

Predictions of the best density-dependence-only model and the best combined model, across a range of densities. For each model, the points depict the upper 95% and lower 5% of 1,000 realizations at each density, while the solid lines show the median at each density. For each simulation of the combined model, we generated weather using a Richardson weather generator (Richardson 1981), which we fit using weather data from our study plots. The initial resting spore density for each model was taken from the respective model’s best-fit value for the central 2010 population. This density was lower for the density-dependence-only model than for the best combined model (appendix), but the density-dependence-only model nevertheless has a high infection rate at low densities due to its high resting spore transmission rate.
