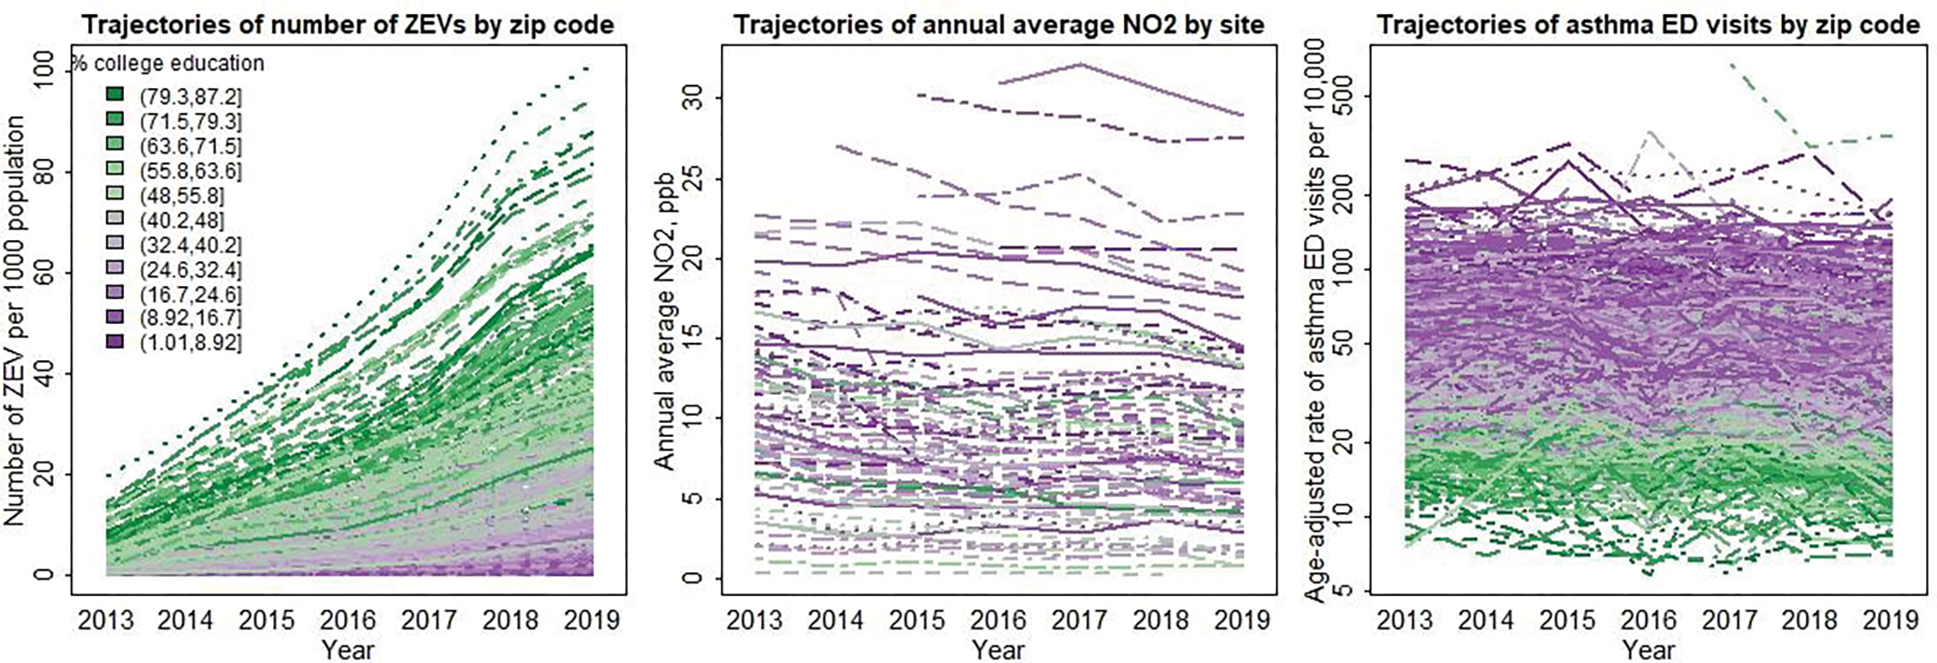
Figure 1.

Longitudinal trends, from 2013–2019 in: (a) number of zero-emissions vehicles (ZEVs) per 1,000 population in 1,238 California zip codes, (b) annual average nitrogen dioxide (NO2) concentrations observed at 107 California monitoring stations, and (c) annual age-adjusted rate of asthma-related emergency department (ED) visits per 10,000 in 1,238 California zip codes. Color indicates educational attainment (% of adults age 25+ with at least a bachelor’s degree) at the zip code level, from lower (purple) to higher (green).
