Figure 3:
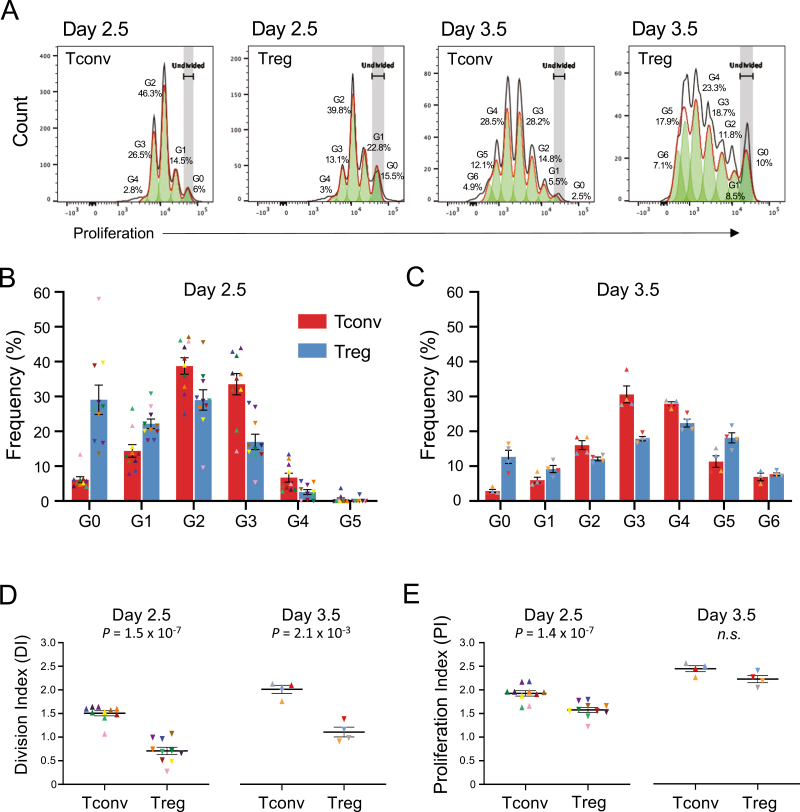
Assessing the proliferative capacity of CD4+ T cells in vitro. (A) Representative histograms depicting the proliferative capacity of CD4+ Tconv and Treg cells after 2.5 or 3.5 days of in vitro culture in the presence of 100 IU/ml IL-2 and TCR stimulation with αCD3/CD28 beads (1 bead: 3 T cells). The respective cell generation (Gn) are shown in each histogram. G0 represents undivided CD4+ T cells. Data were generated from freshly isolated PBMCs from 14 healthy donors (n = 10 and n = 4 for day 2.5 and day 3.5, respectively). (B) Histograms depict the frequency (mean ± SEM) of CD4+ Tconv (red) and Treg (blue) cells at each generation of cell division after 2.5 (B) and 3.5 (C) days of stimulation with αCD3/CD28 beads and 100 IU/ml IL-2, followed by an additional 4 h of co-culture in the presence or absence of the respective CD56+ NK cell subset. The reported frequencies of proliferating CD4+ Tconvs and Tregs for each donor at each generation represent the average of the three co-culture conditions assessed in this study: (i) co-culture with CD56br NK cells; (ii) co-culture with CD56dim NK cells; and (iii) cultured alone in the absence of NK cells (background control to assess spontaneous cell death). The T cell proliferation rates were not affected by the different co-culture conditions, and were therefore averaged to increase the number of T cells assessed. CD4+ Tconvs (depicted by triangles) and Tregs (depicted by inverted triangles) isolated from the same donor are depicted using the same colour. (D) Scatter plots depict the distribution (mean ± SEM) of the observed DI for CD4+ Tconv and Treg cells after co-culture at 2.5 (left panel) or 3.5 (right panel) days of stimulation. (E) Same as for D, but depicting the PI of the cells. P values were calculated using two-tailed paired t-tests. DI denotes the average number of cell divisions undergone by a cell in the original population and PI denotes the average number of divisions among the cells that have divided at least once. n.s., P value not significant.

