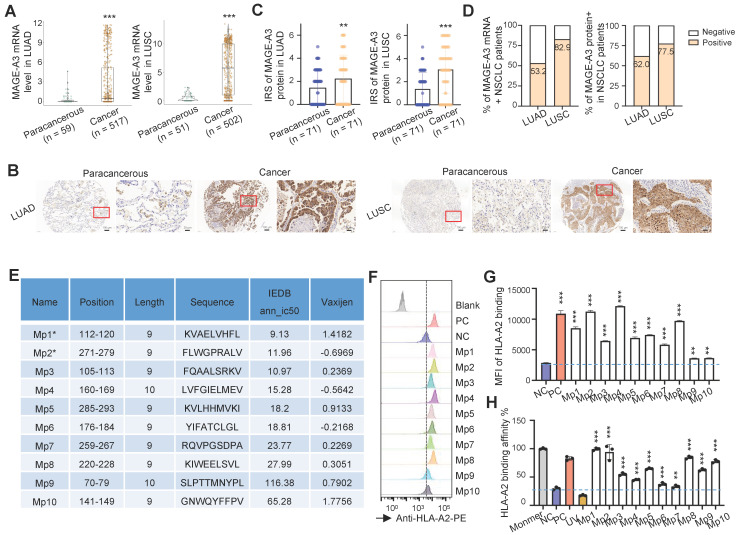
Figure 1.
Identification of HLA-A2-restricted T cell epitopes from MAGE-A3. (A) Boxplots of MAGE-A3 mRNA expression level in LUAD (left, n = 59 paracancerous and n = 517 tumor) and LUSC (right, n = 51 paracancerous and n = 502 tumor) from the TCGA database. (B) Representative immunohistochemistry images of MAGE-A3 protein in LUAD (left) and LUSC (right), and the adjacent lung tissue. (C) Overall statistics of MAGE-A3 immunohistochemistry on sections from the LUAD (left) and LUSC (right) tissue microarray (n = 75). Bar charts show the medians with individual data points, **P < 0.01, ***P < 0.001. (D) Bar charts summarizing the percentage of MAGE-A3 mRNA (left) and protein (right) positive NSCLC patients, respectively. (E) Summary of the predicted HLA-A2 restricted T cell epitopes from MAGE-A3. (F-G) Comparison of the predicted MAGE-A3 epitopes binding affinity to HLA-A2 MHC-I on T2 cells. Binding capacity was presented as mean fluorescence intensity (MFI) of HLA-A2 staining, (F) is the representative plot of (G), **P < 0.01, ***P < 0.001; Blank: no peptides; NC: negative control, EBV virus peptide IVTDFSVIK; PC: positive control, flu M1 peptide GILGFVFTL. Data are shown as mean ± SD. Statistical significance was determined by one-way ANOVA. (H) Evaluation of the predicted MAGE-A3 epitopes binding to HLA-A2 by ELISA assay. Threshold for pMHC formation positivity was set as above the average OD value of the negative control. Monomer: control UV-sensitive peptide without UV irradiation. UV: control UV-sensitive peptide with UV irradiation and free from MAGE-A3 peptide exchange. Data are shown as mean ± SD. Each dot represents a single experiment. **P < 0.01; ***P < 0.001. Statistical significance was determined by one-sided t-test or one-way ANOVA.

