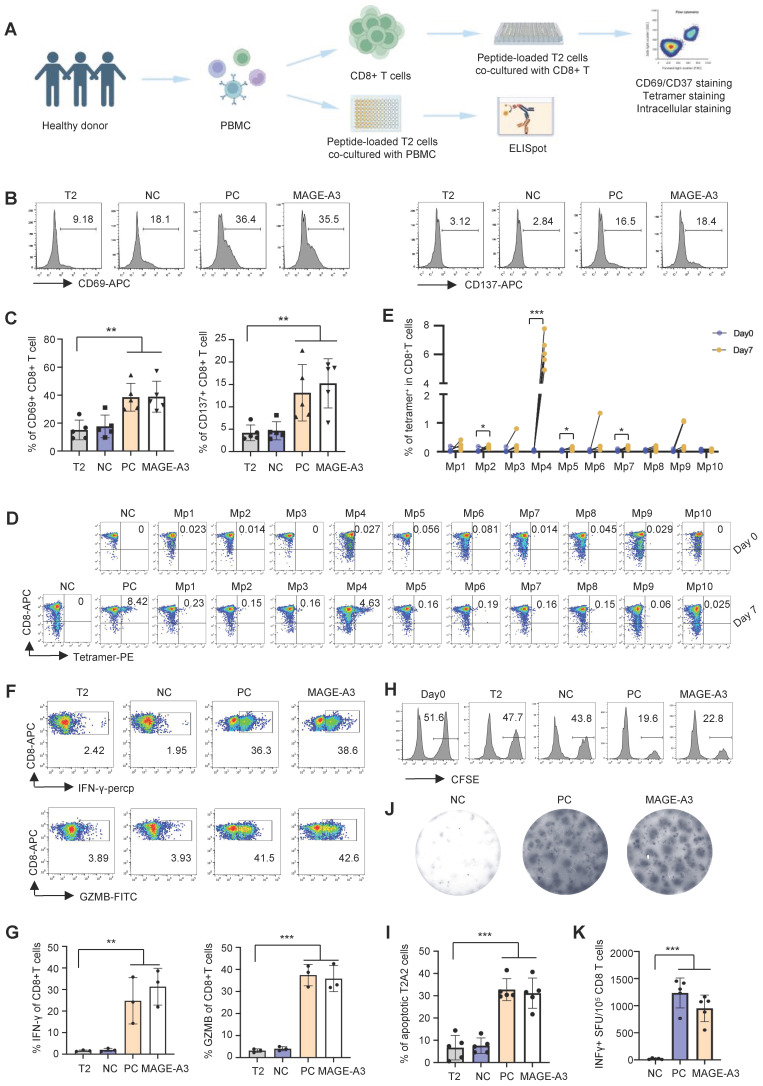
Figure 2.
T cell activation and cytotoxicity induced by epitopes from MAGE-A3. (A) Schematics showing the in vitro screening of MAGE-A3 epitope-specific T cells by artificial APCs. CD8+ T cells from HLA-A2+ healthy donors were co-cultivated with peptide-loaded T2 cells. The T cell activation marker CD69 and CD137 were analyzed at 16h. Tetramer+ CD8+ T cell were detected at day 0 and day 7. Intracellular staining (IFN-γ and GZMB) was used to detect T cell cytotoxicity at day 7. (B-C) Representative FACS results (B) and overall summary statistics (C) of CD8+ T cell activation marker CD69 and CD137 expression after co-cultivation with T2 cells loaded with MAGE-A3 peptides (n = 5). T2: CD8+ T cells co-cultivated with PBS treated T2 cells; NC: CD8+ T cells co-cultivated with EBV peptide loaded T2 cells; PC: CD8+ T cells co-cultivated with flu peptide loaded T2 cells. CD69 and CD137 expression was detected by FACS 16 hours post-cocultivation. (D) Representative FACS plots showing the stimulation of the CD8+ T cells by tetramers. Top row, day 0; bottom row, day 7. CD8+ T cells from healthy donors were co-cultivated with T2 cells loaded with MAGE-A3 peptides for activation. (E) Summary statistics of epitope specific CD8+ T cell (n = 5) before (day 0) and after 7 days stimulation by distinct MAGE-A3 epitopes. (F) Representative FACS plots of IFN-γ (top) and GZMB (bottom) in CD8+ T cells after epitope stimulation for 7 days. Values in each panel indicate the percentage of IFN-γ+CD8+ or GZMB+CD8+ T cells, respectively. (G) Corresponding summary statistics of IFN-γ (left) and GZMB (right) positive CD8+ T cells (n = 3). (H-I) Epitope specific CD8+ T cell mediated cytotoxicity evaluation after 7 days of cell culturing. Representative FACS plots result (H) and corresponding summary statistics (I) of apoptotic cells. CFSE+ T2 cells were counted as survived target cells and the percentage of apoptotic cells was calculated by 50% minus the percentage of survived cells (n = 5), statistical significance was determined by kruskal wallis H test. (J-K) Exemplary microscopy image (J) and summary statistics (K) for anti-IFN-γ ELISpot assay on PBMC cells from HLA-A2+ healthy donors stimulated by distinct epitopes (n = 5). NC: PBMC co-cultivated with EBV peptide loaded T2 cells; PC: PBMC co-cultivated with T2 cells in the existence of anti-CD3 mAb CD3-2; MAGE-A3: PBMC co-cultivated with MAGE-A3 peptides loaded T2 cells. Data are shown as mean ± SD. **P < 0.01; ***P < 0.001. Each dot represents a single experiment. Statistical significance was determined by one-sided t-test or one-way ANOVA.

