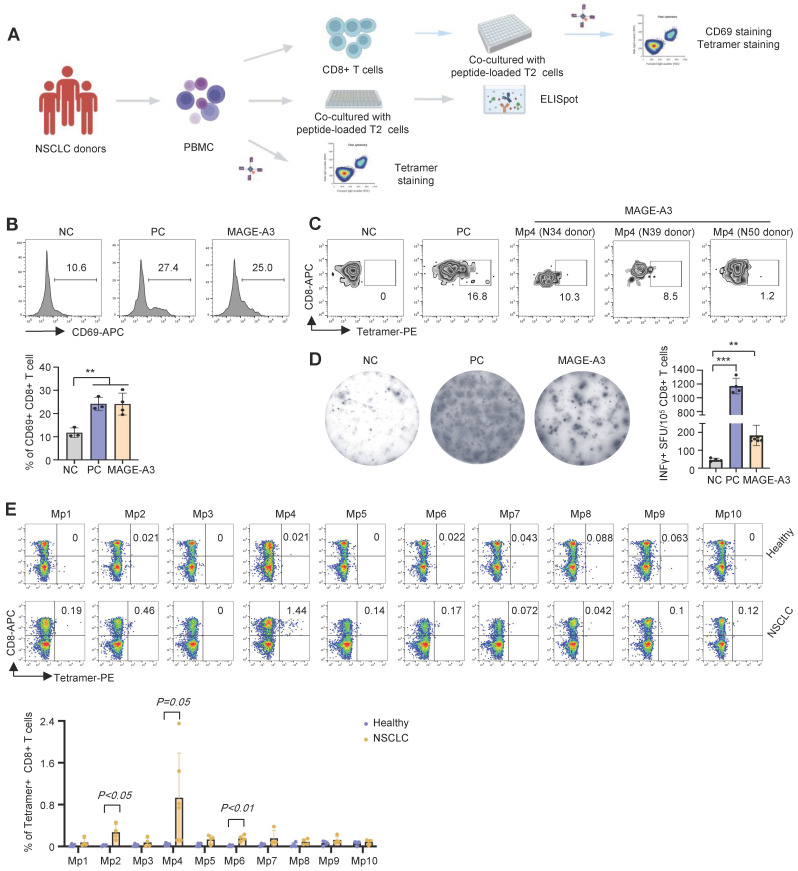
Figure 3.
Characterization of cytotoxic effects of MAGE-A3 epitope-specific T cells. (A) Schematics showing the procedure used to verify immunogenic MAGE-A3 epitopes in HLA-A2+ NSCLC patients. (B) Representative FACS plots (up) and overall summary (down) of CD8+ T cell activation marker CD69 expression after co-cultivation with T2 cells loaded with MAGE-A3 peptides (n = 3). (C) Representative FACS plots showing the stimulation of the CD8+ T cells by tetramer prepared with MAGE-A3-Mp4 epitope (n = 3). CD8+ T cells from NSCLC donors were co-cultivated with T2 cells loaded with MAGE-A3 peptides for 3 days. (D) Representative images (left) and summary statistics (right) for anti-IFN-γ ELISpot assay (n = 7 for mixed; n = 4 for NC and PC). PBMC cells from HLA-A2+ NSCLC donors were co-cultivated with T2 cells loaded with MAGE-A3 peptides for 48 hours. (E) Up: Representative FACS plots of T cell staining with the indicated tetramers from the PBMC of HLA-A2+ healthy donors or HLA-A2+ NSCLC patients. Down: Percentage comparison of tetramer+CD8+ T cells between healthy donors (n = 4) and NSCLC patients (n = 6 for Mp4; n = 4 for the others). Data are shown as mean ± SD. **P < 0.01; ***P < 0.001. Each dot represents a single experiment. Statistical significance was determined by one-sided t-test or one-way ANOVA.

