Figure 4.
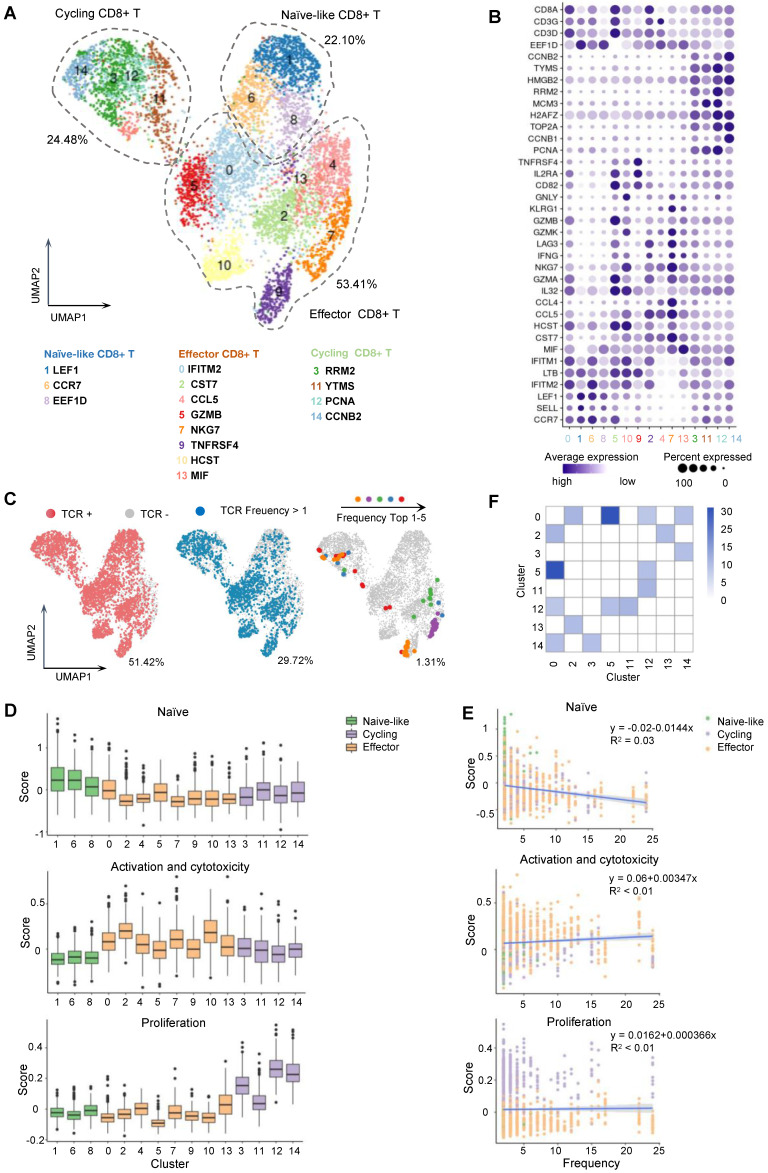
Single-cell transcriptome and TCR landscape of CD8+ T cells specific to MAGE-A3-Mp4 epitopes. (A) Uniform manifold approximation and projection (UMAP) visualization of the scRNA-seq data from 5891 tetramer sorted MAGE-A3-Mp4 epitope-specific CD8+ T cells. The identified cell clusters (n = 15) are depicted with distinct colors. Cluster-specific genes are shown adjacent to each cluster ID, respectively. (B) Dot plot of marker genes for each T cell subtypes. Color-scale shows the average normalized expression of marker genes in each subtype, and dot size indicates the percentage of cells within each cell cluster expressing the marker gene. The cluster IDs on x-axis is the same as (A). (C) UMAP visualization with total TCR sequence detection information (left), the TCR clonotype expansion (clonotype frequency > 1) information (middle) and the top 5 most frequent TCR clonotype information for MAGE-A3-Mp4 epitope. (D) Single-cell transcriptome-derived CD8+ T cell naivety, proliferation and activation, and cytotoxicity score comparison between cell clusters. Gene panels used for naivety, activation and cytotoxicity, and proliferation score calculation are listed in Table S5. (E) Scatter-plot visualization of CD8+ T cell TCR clonotype frequency (x-axis) vs. cell naivety, activation and cytotoxicity, and proliferation score, respectively. Each dot represents a CD8+ T cell, with color corresponds to its annotated subtype. Blue lines are fitted by linear model with grey area indicating the 95% confidence band. Spearman correlations (ρ) are also shown. (F) Heatmap visualization of numbers of TCR clonotypes shared by two CD8+ T cell clusters. Only cell clusters with shared clonotypes > 10 with at least one other cluster are shown. For boxplots, the outlines of the boxes represent the first and third quartiles. The line inside each box represents the median, and boundaries of the whiskers are found within the 1.5×IQR value.

