Figure 5.
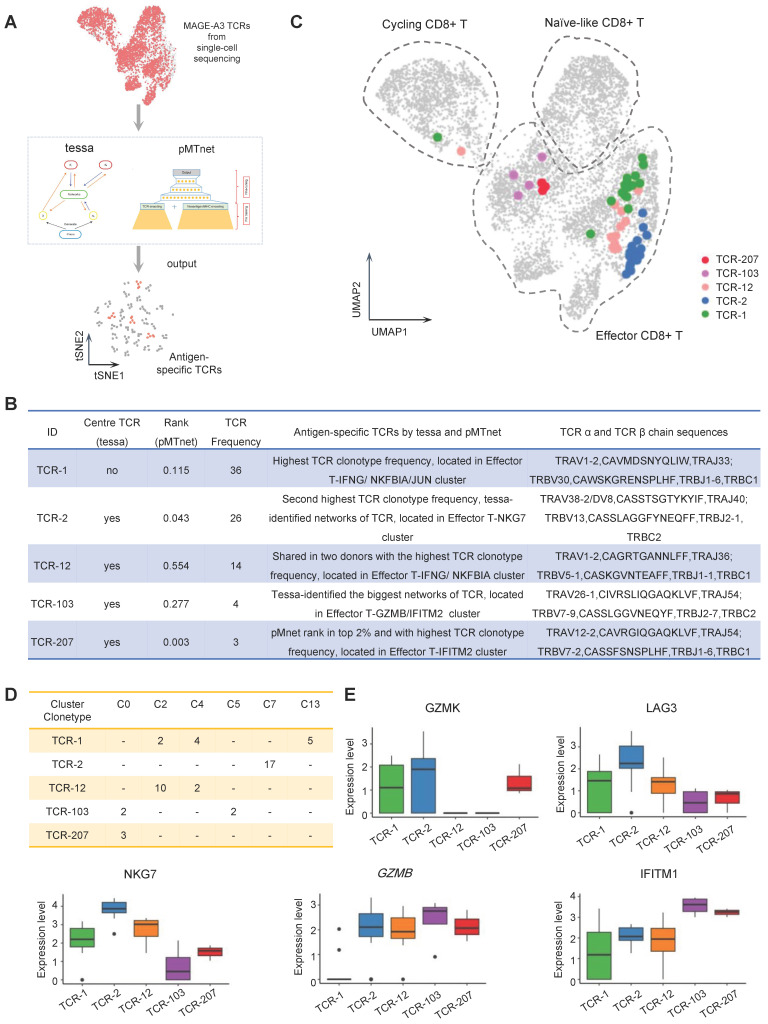
Antigen-specific TCRs screening by machine-learning. (A) Schematic workflow for inferring MAGE-A3 antigen specificity for the CD8+ T cells from health donors using the tessa and pMTnet machine-learning framework, respectively. (B) The detailed information of the selected candidate TCRs. (C) UMAP visualization of the MAGE-A3-Mp4 epitope-specific CD8+ T cells with the 5 selected candidate TCR sequences information projection. (D) The clonotype expansion distribution information of the 5 selected candidate TCRs in the corresponding CD8+ T cell cluster. (E) Boxplot of selected gene expression level of CD8+ T cells with the 5 selected candidate TCRs. For boxplots, the outlines of the boxes represent the first and third quartiles. The line inside each box represents the median, and boundaries of the whiskers are found within the 1.5×IQR value.

