Figure 6.
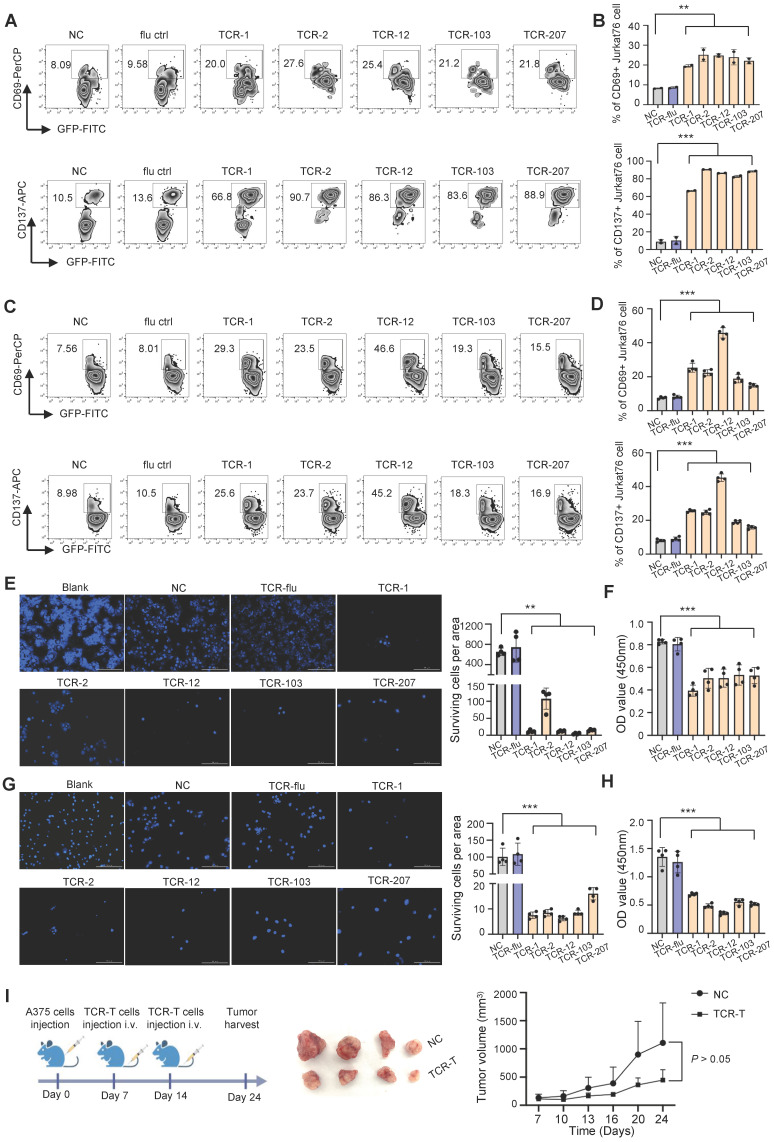
T cells expressing the candidate TCRs responds to MAGE-A3 antigen in vitro and in vivo. (A-B) Representative FACS plots (A) and overall summary statistics (B) of J76 cells expressing activation marker CD69 and CD137. J76 cells expressing TCR-1, TCR-2, TCR-12, TCR-103 and TCR-207 were co-cultured with PC9 lung cancer cells. CD69 and CD137 expression was detected by FACS 16 hours post-cocultivation (n = 2). (C-D) Same as (A-B), but for J76 cells expressing TCR-1, TCR-2, TCR-12, TCR-103 and TCR-207 co-cultured with A375 melanoma cells. CD69 and CD137 expression was detected by FACS 16 hours post-cocultivation (n = 4). (E) Representative Hoechst staining of PC9 cells (left) and summary statistics of surviving cell counts (right; n = 4). (F) Bar plots showing the summary statistics of OD value (n = 4). The PC9 cells were co-cultivated with J76 cells expressing the candidate TCRs for 96h. (G) Representative Hoechst staining of A375 cells (left) and summary statistics of surviving cell counts (right; n = 4). (H) Bar plots showing the summary statistics of OD value (n = 4). The A375 cells were co-cultivated with J76 cells expressing the candidate TCRs for 96h. (I) Experiment overview of in vivo anti-tumor assessment (left), visual observation of the tumors (middle) and tumor growth curves of mice grouped by treatment with TCR-T (TCR-2 and TCR-12) cells (1×10⁷) or control-T cells (1×10⁷) (right), mice (n=4). Data are shown as mean ± SD. **P < 0.01; ***P < 0.001. Each dot represents a single experiment. Statistical significance was determined by one-sided t-test or one-way ANOVA.

