Figure 8.
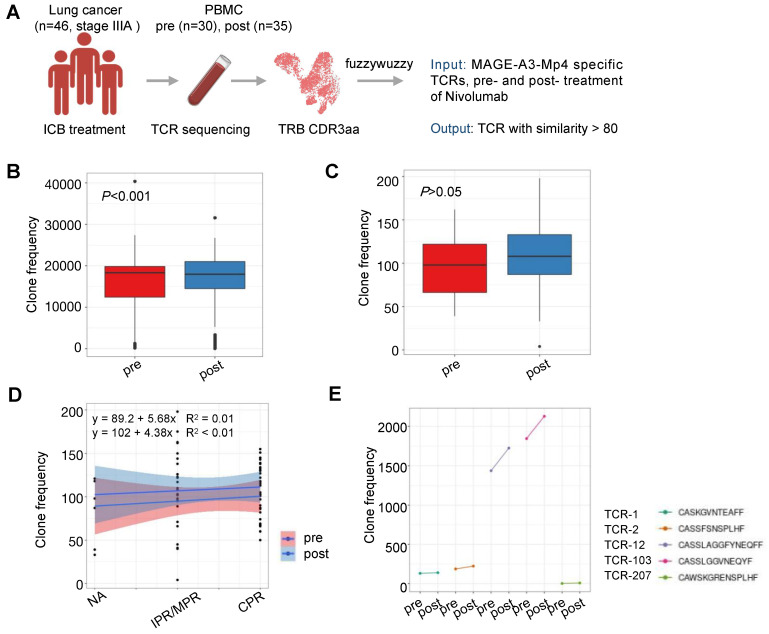
Characterization of MAGE-A3-specific TCR clonotype expansion in lung cancer patients responding to ICB treatment. (A) Schematics of analysis workflow (also see Methods). (B) Boxplot comparison of the number of TCRs from lung cancer patients before and after ICB treatment matching MAGE-A3-Mp4 specific TCRβ CDR3 sequences from our single-cell sequencing data. 80% CDR3 amino acid sequence similarity was considered as a match. For boxplots, the outlines of the boxes represent the first and third quartiles. The line inside each box represents the median, and boundaries of the whiskers are found within the 1.5IQR value. Statistical significance was determined by Wilcoxon. (C) Same as B, but for comparing the TCR repertoires of lung cancer patients pre- and post-treatment to the 5 selected candidate TCR sequences (i.e., TCR-1, TCR-2, TCR-12, TCR-103 and TCR-207). Statistical significance was determined by paired t test. (D) Scatter plot showing the number of TCRs from lung cancer patients pre- and post-treatment in different pathologic response condition matching the 5 candidate TCRs. IPR, minor pathologic response. MPR, major pathologic response. NA, not otherwise specified. CPR, complete pathologic response. (E) Statistics of sum of TCRs from lung cancer patients pre- and post-treatment matching each of the 5 candidate MAGE-A3-Mp4 specific TCRs.

