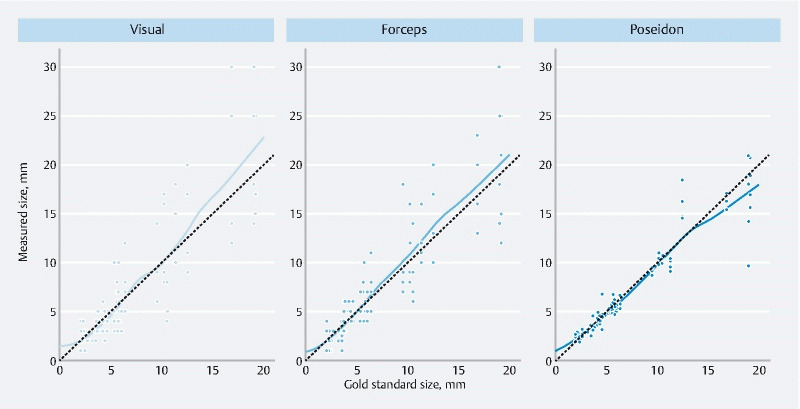
Fig. 3.

Scatter plots of measurement results plotted against the corresponding gold standard sizes for each sizing method. The dashed lines represent exact values, with the points closer to the lines being more accurate measurements. Points above the dashed line are overestimates, while those below underestimate the polyp size. The fitted curves show the over- or underestimation tendency of each sizing method.
