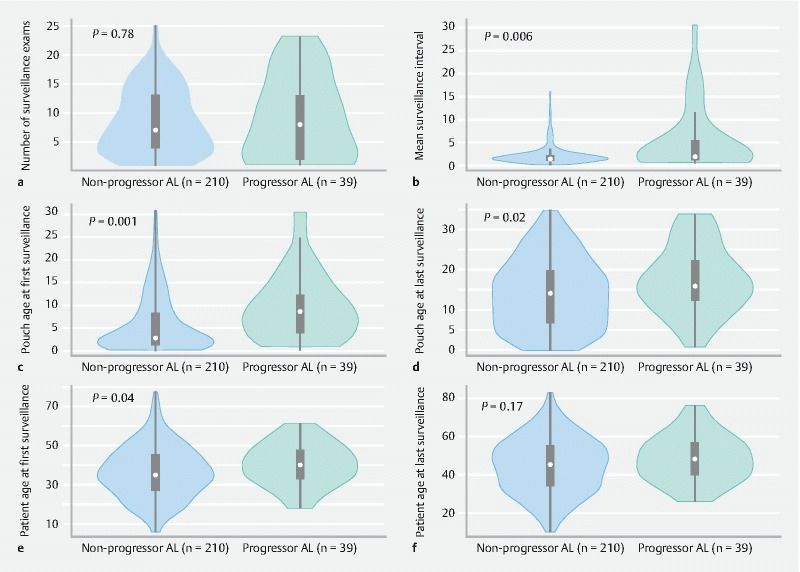
Fig. 2.

Violin plots comparing the surveillance data of patients who progressed to advanced lesions versus those who did not progress ( P values for Mann–Whitney U test), with results provided for: a number of surveillance examinations; b mean surveillance interval between examinations for each patients; c pouch age at first surveillance; d pouch age at last surveillance; e patient age at first surveillance; f patient age at last surveillance.
