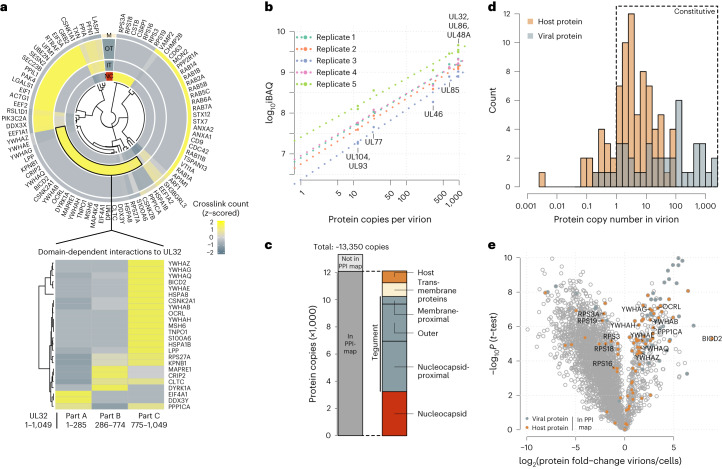
Fig. 3. Abundant and layer-specific incorporation of host proteins.
a, Top: heat map depiction of host protein localization across virion layers. Crosslink counts of host proteins to viral proteins of the respective layers (NC, nucleocapsid; IT, inner tegument (nucleocapsid-proximal tegument); OT, outer tegument; M, membrane, including viral transmembrane proteins and membrane-proximal tegument) were z-scored and hierarchically clustered using Euclidean distance. Bottom: z-scored crosslink counts of inner-tegument-localized host proteins to different parts of UL32. b, iBAQ of protein copy numbers using the copy numbers of nucleocapsid-associated proteins as standard (n = 2 biological replicates, with technical duplicates or triplicates). The offset between the replicates is caused by differences in the amount of input material, but the similar slopes demonstrate reproducibility of the quantitative data. c, Protein copies represented in the PPI map and their subvirion localization. d, Histogram of copy numbers from host and viral proteins. Proteins with more than one copy number on average are classified as likely constitutive. e, Relative quantification of proteins comparing virion lysates to cell lysates. Proteins included in the PPI map are highlighted. See Extended Data Fig. 4a for experimental design. Means of fold-change differences and P values of a two-sided t-test without multiple hypothesis correction are based on n = 4 biological replicates.

