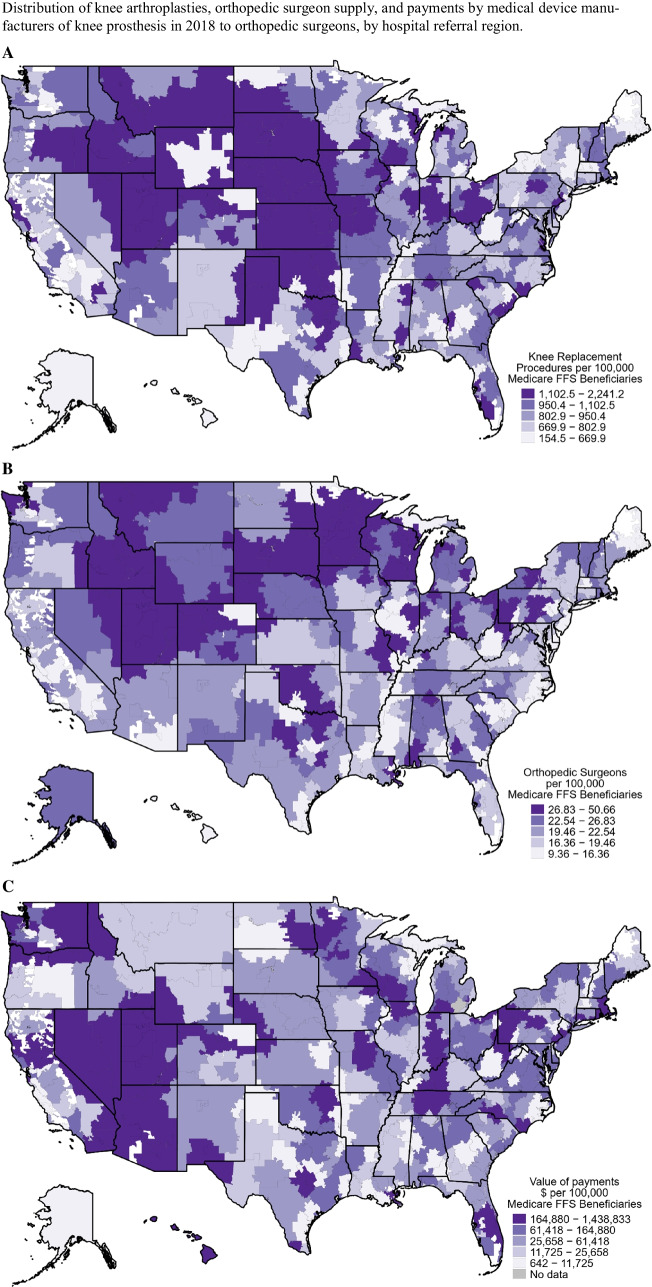
Figure 2.
A Number of knee arthroplasties per 100,000 Medicare FFS beneficiaries in each healthcare referral region. B Map showing number of orthopedic surgeons performing knee arthroplasties per 100,000 Medicare FFS beneficiaries in each healthcare referral region. C Payments in $ per 100,000 Medicare FFS beneficiaries from medical device manufacturers of knee joints to orthopedic surgeons in each healthcare referral region. For all panels, darker purple indicates higher quintile values.

