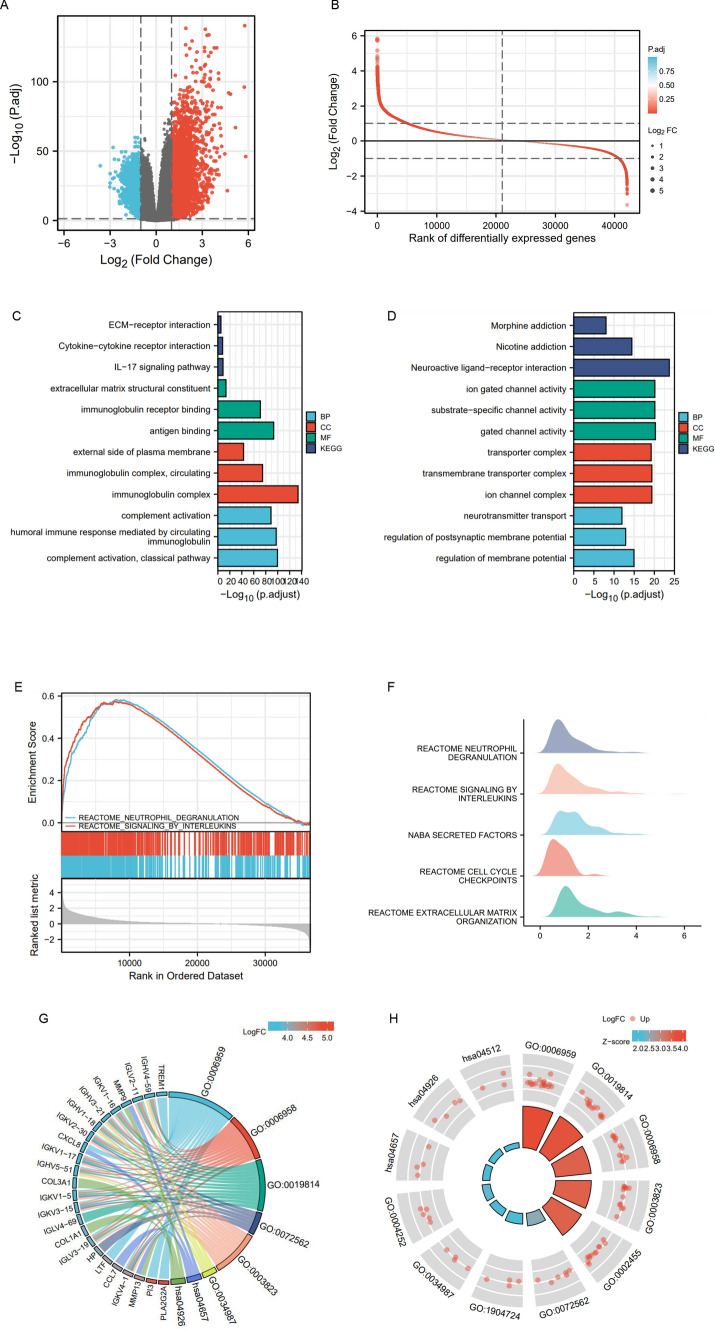
Fig. 3.
The analysis of differentiated genes in CAV1-High and -low groups in glioma patients. A The volcano plot shows the DEGs in CAV1-high and -low groups. B The Rank of differentially expressed genes. C The GO and KEGG analysis of high expressed genes in CAV1-high groups. D The GO and KEGG analysis of low expressed genes in CAV1-low groups. E The GSEA analysis or the DEGs. F–H The GSEA analysis in ridge plot of DEGs. G The combinational analysis of GO/KEGG and LogFC of CAV1-high groups

