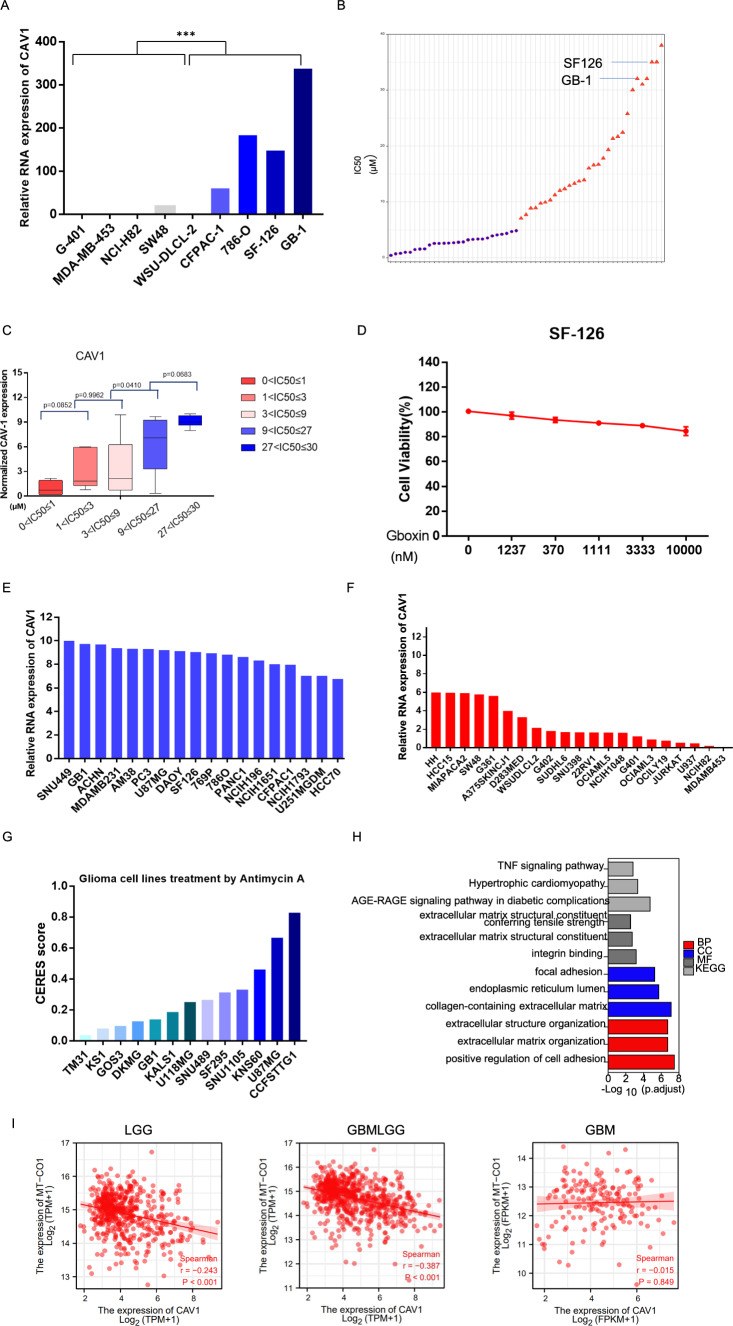
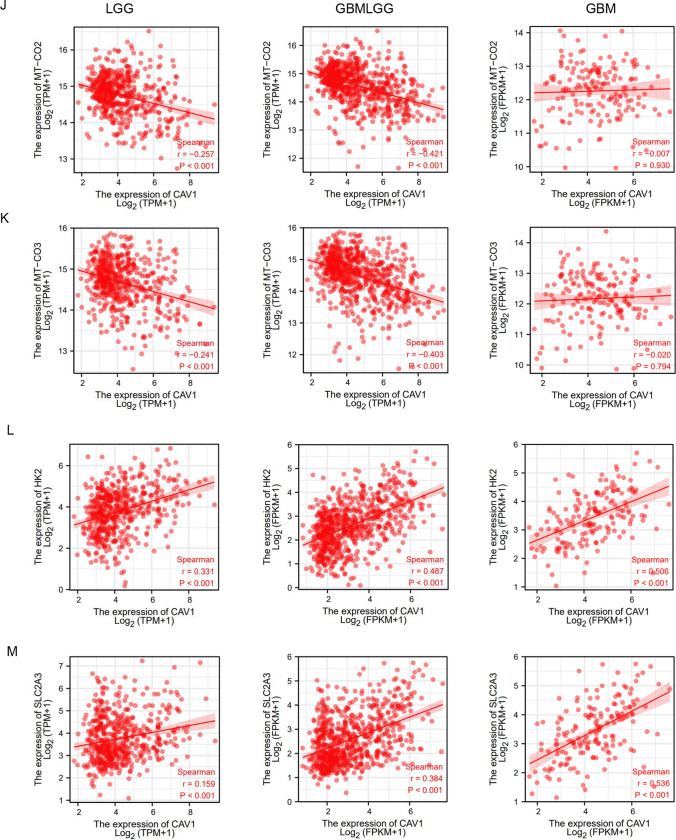
Fig. 7.
High expression of CAV1 renders the glioma cells OXPHOS inhibition. A Relative RNA expression of CAV1 in 9 cancer cells that we did RNA-sequencing, among which GB-1 and SF-126 are the human glioma cells. B The IC50 of all 57 cancer cell lines after treatment of Gboxin (the OXPHOS inhibitor) for 72 h. Glioma cancer cells SF-126 and GB-1 were marked. C The correlation between the expression of CAV1 and the OXPHOS-resistant cancer cell’s IC50. D Cell Viability test for SF-126 human glioma cancer cell line under Gboxin treatment in different dosages in 72 h. E The relative expression of CAV1 of OXPHOS-inhibition resistant cancer cell line, data from CCLE. F The relative expression of CAV1 of OXPHOS-inhibition sensitive cancer cell line, data from CCLE. G DepMap PRISM data shows more glioma cells under treatment with OXPHOS inhibitor Oligomycin A. The CERES scores were marked. H The GO/KEGG analysis of high-expressed genes in OXPHOS-inhibition groups. I The correlation between the expression of CAV1 in LGG gliomas with key OXPHOS genes including mt-CO1, mt-CO2 and mt-CO3. J The correlation between the expression of CAV1 in GBMLGG gliomas with key OXPHOS genes including mt-CO1, mt-CO2 and mt-CO3. K The correlation between the expression of CAV1 in GBM gliomas with key OXPHOS genes including mt-CO1, mt-CO2 and mt-CO3. L The correlation between the expression of CAV1 and HK2 in gliomas. M The correlation between expression of CAV1 and GLUT3 (SLC2A3) in gliomas. *p value < 0.05; **p value < 0.01;***p value < 0.001


