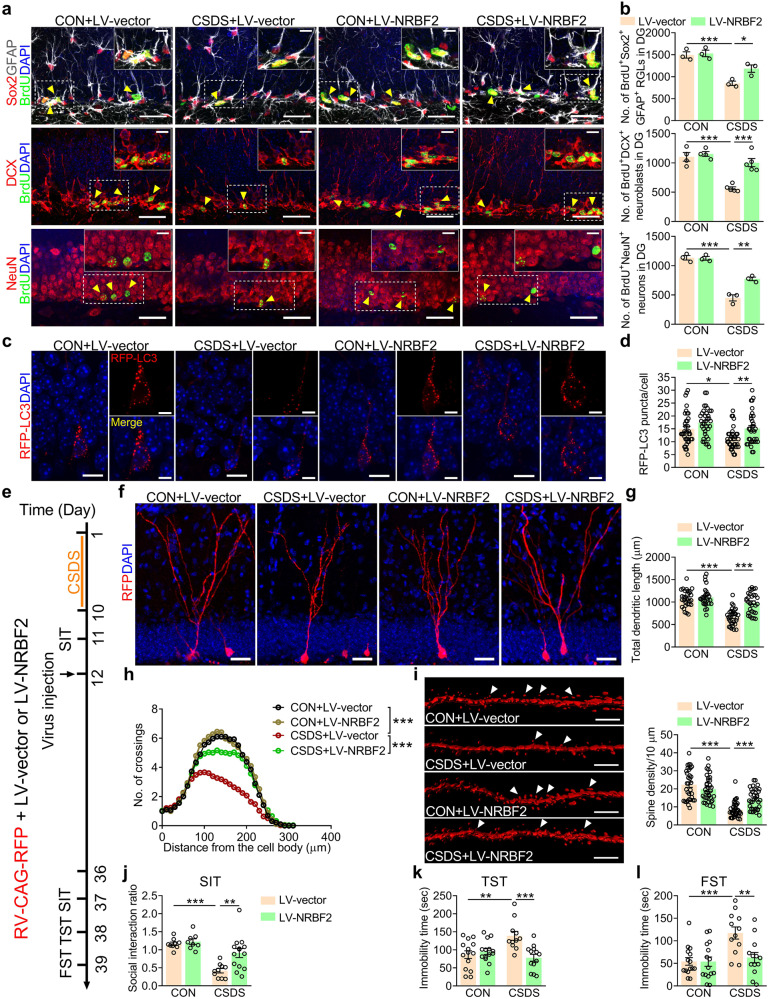
Fig. 2. Overexpression of NRBF2 in the DG improves CSDS-induced AHN impairment and depression-like behavior of mice.
a Representative images of BrdU+Sox2+GFAP+ RGLs, BrdU+DCX+ neuroblasts, and BrdU+NeuN+ neurons in the DG of control and CSDS-exposed mice treated with LV-vector or LV-NRBF2. Higher magnification views of selected regions (white rectangle). Yellow arrows indicate BrdU+ and marker+ cells. Scale bars, 30 μm (overview) and 10 μm (inset). b Quantification of BrdU+Sox2+GFAP+ RGLs, BrdU+DCX+ neuroblasts, and BrdU+NeuN+ neurons in the DG (n = 3–5 mice per group). c, d Representative image (c) and quantification (d) of RFP-LC3 puncta in the DG (n = 32–36 cells per group). Scale bars, 10 μm (overview) and 5 μm (zoom). e Timeline of experiments. f–h Representative images (f) and quantification of dendritic length (g) and dendritic complexity (h) in RFP+ newborn neurons (n = 29–33 cells per group). Scale bars, 30 μm. i Representative images and quantification of dendritic spine density of newborn neurons (n = 33–37 segments per group). White arrows indicating spines. Scale bars, 5 μm. j–l Behavioral tests of SIT (j), TST (k), and FST (l) in control and CSDS-exposed mice treated with LV-vector or LV-NRBF2 (n = 8–15 mice per group). Data are presented as means ± SEM and analyzed by two-way ANOVA followed by Bonferroni’s post hoc test (b, d, g, i–l) or repeated measures ANOVA (h). *P < 0.05, **P < 0.01, and ***P < 0.001.

