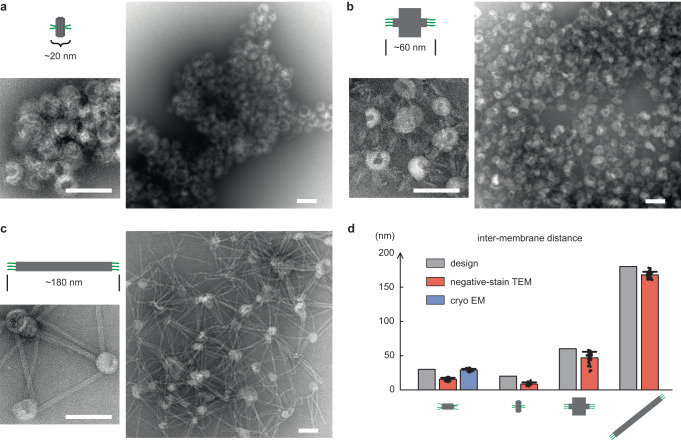
Fig. 3. Distance-controlled liposome clusters mediated by customized DNA nanostructures.
a–c Representative negative-stain TEM images of liposomes interconnected by 6HB tiles with side handles (a), 60-nm origami brick (b), and 180-nm origami rod (c). Cartoon model and theoretical full length of each DNA structure is shown on the left of each panel. Scale bars: 100 nm. d Bar graph of inter-membrane distances measured in negative-stain (orange) or cryo (blue) EM images. N = 47, 16, 34, 40 for negative-stain EM in each case from left to right. N = 29 for cryo EM. Source data are provided as a Source Data file. Individual data points are overlaid with corresponding bar chart. Center and top of error bar represent mean and standard deviation. The cryo measurement matches the design (gray) well, while the negative-stain measurement is shorter than the design partly due to vesicle flattening on substrate.

