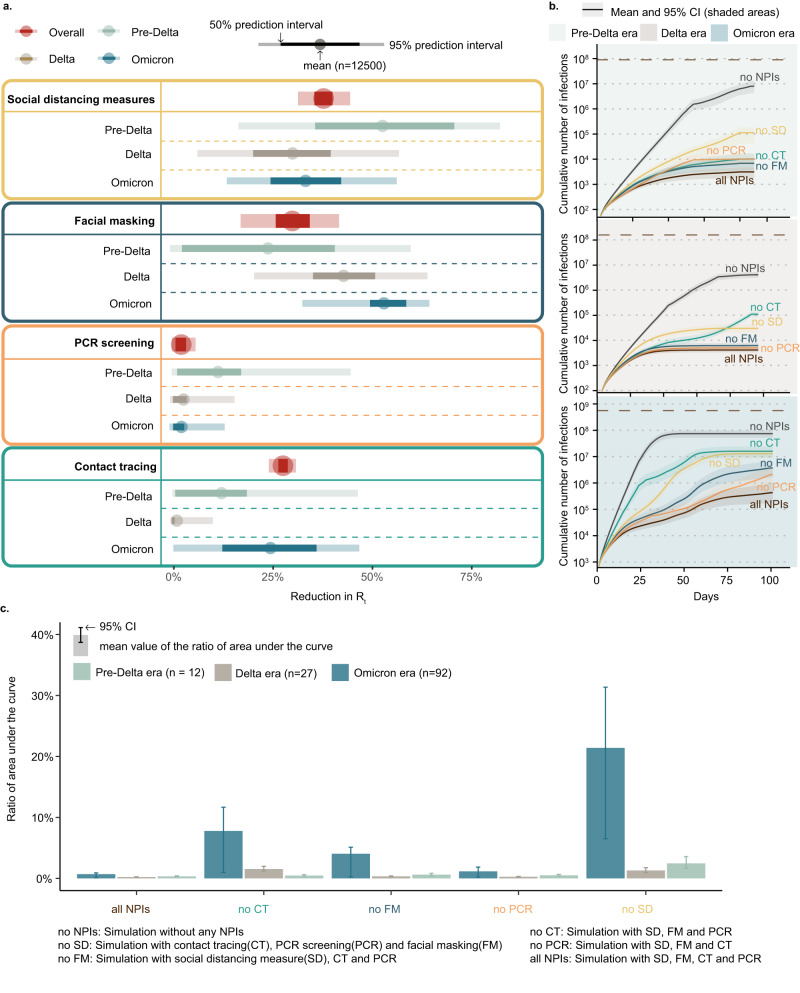
Fig. 2. The relative effects of interventions in containing different SARS-CoV-2 variants.
a The overall effects were estimated by the coefficient of each individual NPI in Bayesian inference models. Reductions in were shown as mean, 50%, and 95% prediction intervals. PCR screening showed the joint effect of mass screening and medicine management (generic antipyretics, not specific drugs for COVID-19). Social distancing measures represented the joint effect of stay-at-home order, business premises closure, public transportation closure, gathering restriction, workplace closure, and school closure. b Infections simulated by Intervention-SEIR-Vaccination (ISEIRV) model under all real-world NPIs (curves in brown) or in counterfactual scenarios where social distancing measures (SD), facial mask (FM), contact tracing (CT), PCR screening (PCR), or all NPIs were not implemented, respectively. Mean and 95% confidence intervals (CI, shaded areas) are presented. The brown dashed lines are the total population of cities with outbreaks of each variant. The gap between the simulated curve without each NPI and the red curve represents the effect of each removed NPI in containing the spread. The wider the gap, the higher the effect of NPIs. c The ratio of the area under the cumulative infection curve for the corresponding scenario (with one NPI removed) to the area under the baseline scenario curve (with all NPIs removed). The closer it gets to 100% indicates the more effective the removed NPI is for the respective variant.

