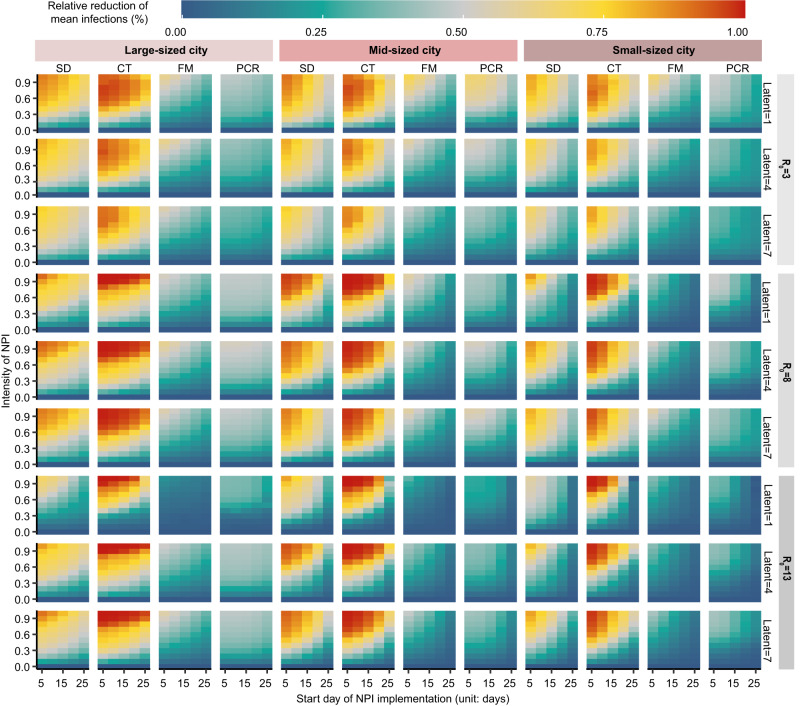
Fig. 3. The relative reduction of infections of emerging pathogens under different scenarios of transmissibility, interventions, and population sizes.
Relative reduction of mean infections is the daily mean infections for each scenario, relative to the baseline counterfactual scenario without any interventions. A value closer to 1 (red) indicates fewer infections for a scenario, corresponding to a more effective implementation of NPIs. The values show simulated transmission under different values and latent periods in large cities (LC, over 10 million residents), medium cities (MC, 5–10 million residents) and small cities (SC, 0–5 million residents). In each small heatmap, the x axis is the start day of NPI implementation for each outbreak and the y axis is the intensity of NPI. The results shown here are the independent effect of social distancing measures (SD), contact tracing (CT), facial masks (FM), and PCR screening (PCR), respectively, meaning that if one NPI was in place, all other interventions were not implemented.

