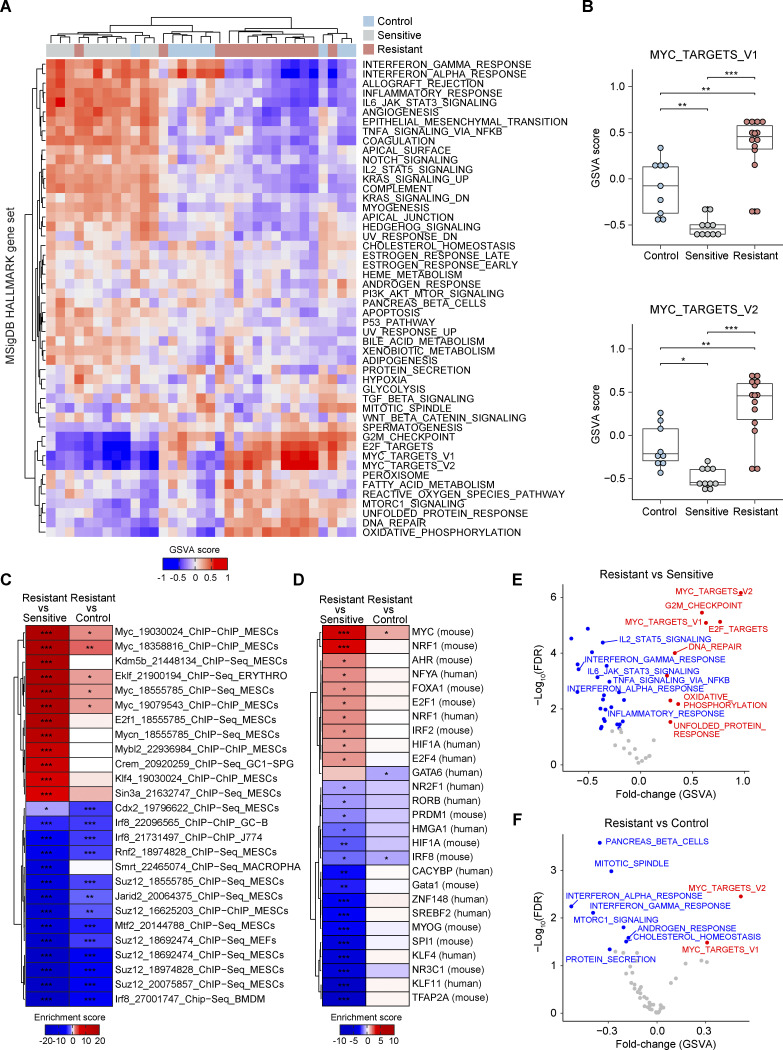
Figure 2.
Functional MYC activity in AZD8055-resistant tumors. (A) GSVA analysis for 50 MSigDB Hallmark gene sets across RNA-seq profiles derived from 9 control, 10 sensitive, and 14 resistant KEP tumors. Hierarchical clustering (Euclidean distance and complete-linkage clustering) was performed for GSVA scores. (B) GSVA scores for the two MSigDB Hallmark MYC target gene sets. Data are represented as median ± IQR (box) and quartiles ± 1.5 × IQR (whiskers), and one-way ANOVA and Tukey’s post-hoc test were performed to compute adjusted P values (*P < 0.05; **P < 0.01; ***P < 0.001). (C and D) TF target and motif enrichment analyses for upregulated and downregulated genes in resistant vs. sensitive and resistant vs. control comparisons (RNA-seq profiles derived from 9 control, 10 sensitive, and 14 resistant KEP tumors). TF targets and motifs were obtained from ChEA2016 (C) and TRANSFAC_and_JASPAR_PWMs (D), all collected in the EnrichR database (Kuleshov et al., 2016). TF enrichment scores were defined as −log10(FDR) for upregulated genes in each comparison and as the additive inverse of −log10(FDR) for downregulated genes in each comparison and computed by Fisher’s exact test followed by Benjamini & Hochberg correction. Row labels in C, “TF name”_“Pubmed ID”_“experimental assay”_“cell line”. *FDR < 0.05; **FDR < 0.01; ***FDR < 0.001. (E and F) GSVA analysis for resistant versus sensitive (E) and resistant versus control (F) tumors using MS-based expression proteomic data (6 control, 4 sensitive, and 8 resistant KEP tumors). GSVA scores were compared using Student’s t test. Red and blue dots, significantly (FDR < 0.05) up- and downregulated in resistant tumors.

