Figure 4.
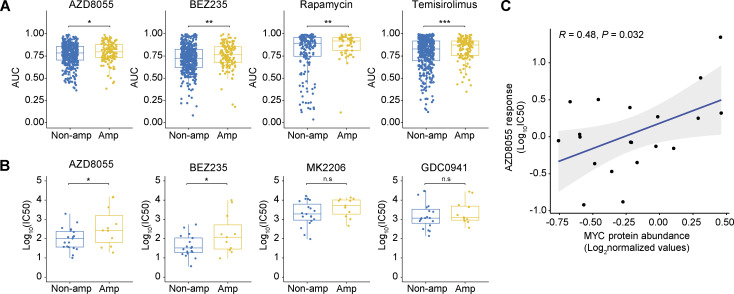
Association between MYC status and mTORi response in human cancer cell lines. (A and B) Comparisons of mTORi responses of cancer cell lines with and without MYC amplifications. In A, AUC values and MYC amplification status were obtained from the cBioPortal database (Gao et al., 2013). A total of 1,010 cell lines were analyzed (MYC amplification, n = 209; MYC non-amplified, n = 801). In B, IC50 values and MYC amplification status were obtained from a previously published breast cancer cell line dataset (Jastrzebski et al., 2018). Data are represented as median ± IQR (box) and quartiles ± 1.5 × IQR (whiskers) and P values were computed with one-tailed Student’s t tests (*P < 0.05; **P < 0.01; ***P < 0.001; n.s, not significant; P = 0.04, 0.04, 0.06, and 0.25 for AZD8055, BEZ235, MK2206, and GDC0941, respectively). A total of 30 cell lines were analyzed (MYC amplification, n = 11; MYC non-amplified, n = 19). (C) Correlation between AZD8055 response and MYC protein abundance in 20 human breast cancer cell lines. P value was calculated with two-tailed t-transformation of Pearson’s correlation coefficient. IC50 values were obtained from the GDSC database (Yang et al., 2013) and MYC protein levels, as measured by MS, were obtained from the CCLE database (Barretina et al., 2012). Source data are available for this figure: SourceData F4.

