Figure 7.
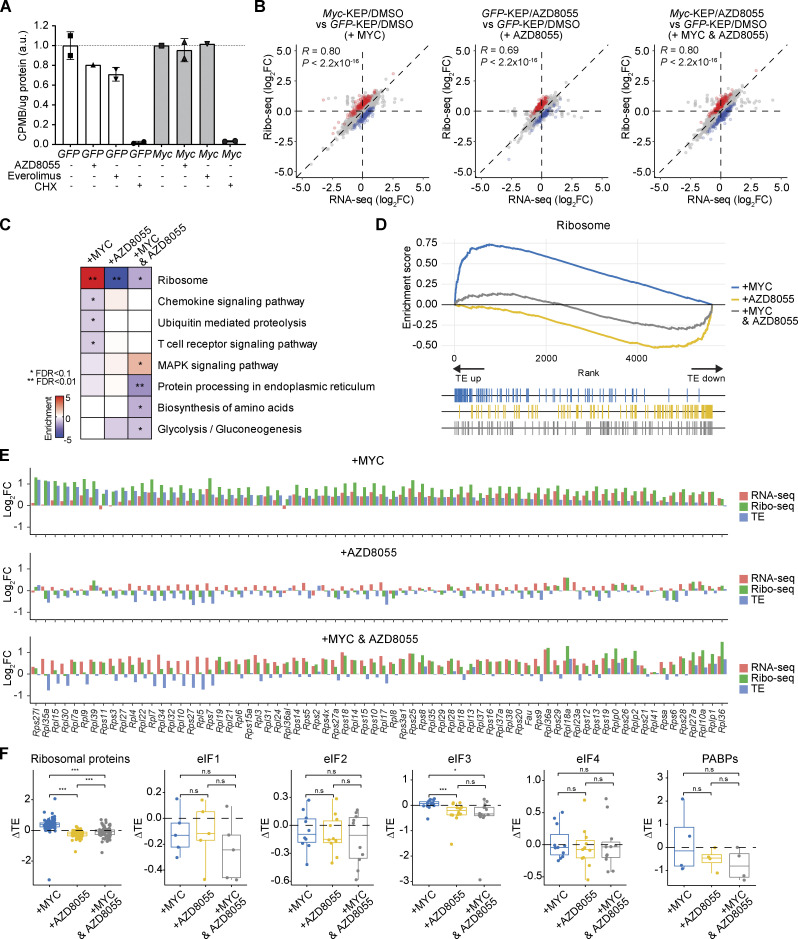
MYC enhances the translation efficiency of ribosomal genes. (A) [35S]-methionine incorporation assay performed with KEP1.23 cells overexpressing GFP or Myc and treated for 2 h with vehicle, 50 nM AZD8055, or 10 nM everolimus prior to a 1 h pulse with [35S]-labeled methionine. 100 μg/ml cycloheximide (CHX) was added as a positive control to stop protein translation. Incorporation of [35S]-methionine was quantified by scintillation counting and normalized to total protein. Data are represented as mean ± standard deviation of n = 2 technical replica per group (GFP-DMSO, GFP-everolimus, GFP-CHX, Myc-AZD8055, and Myc-CHX) or n = 1 replica (GFP-AZD8055, Myc-DMSO, and Myc-everolimus) of one experiment and normalized to their corresponding DMSO treated condition. (B) Correlations of log2(FC) values between Ribo-seq reads and RNA-seq reads in indicated comparisons. Blue and red dots indicate genes showing enhanced or suppressed TEs, respectively. (C) Functional enrichment analysis using Kyoto Encyclopedia of Genes and Genomes pathways for genes with significantly altered TEs upon Myc overexpression, AZD8055 treatment, or the both, each compared to GFP-DMSO. Fisher’s exact test was performed followed by FDR correction. *FDR < 0.05, **FDR < 0.01. (D) Gene set enrichment plot showing changes in TEs upon Myc overexpression, AZD8055 treatment, or the both, each compared to GFP-DMSO. (E) Log2FC values for all quantified ribosomal genes computed from RNA-seq reads (red), Ribo-seq reads (green), and TE (blue) for each comparison. (F) Log2FC values of TE (ΔTE) in each condition when compared to GFP-DMSO for different protein synthesis factors. Data are represented as median ± IQR (box) and quartiles ± 1.5 × IQR (whiskers), and one-way ANOVA and Tukey’s post-hoc test were performed to compute adjusted P values (*P < 0.05; ***P < 0.001; n.s, not significant).

