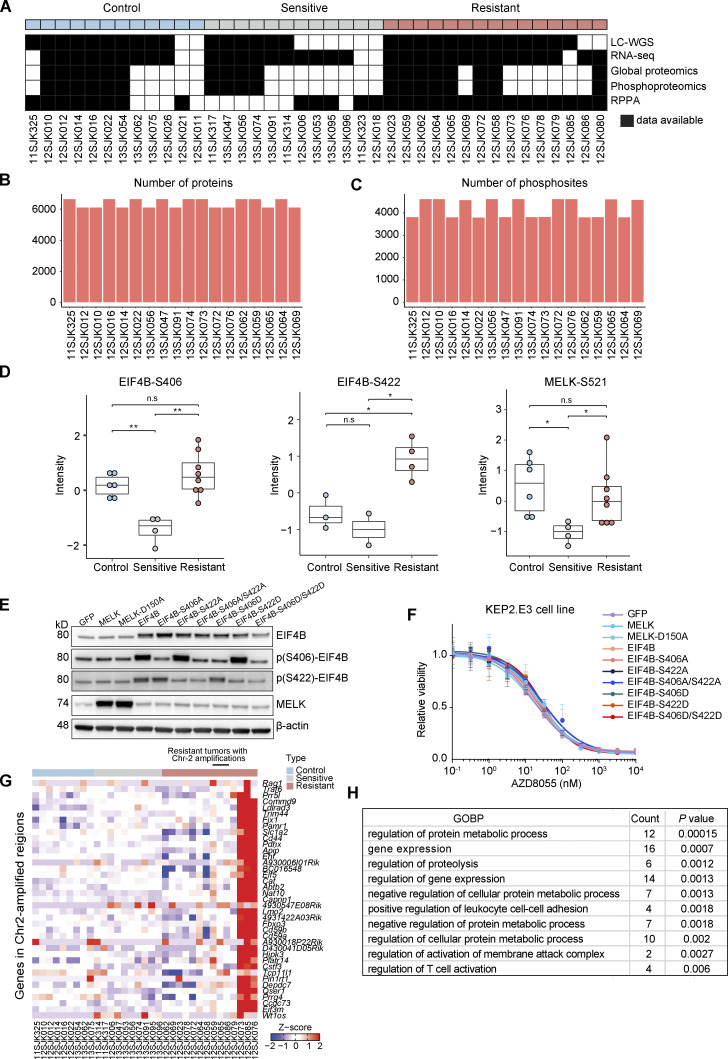
Figure S1.
Multiomic molecular profiling of KEP tumors. (A) Control (n = 12), sensitive (n = 12), and resistant (n = 15) KEP tumors were analyzed by LC-WGS, RNA-seq, MS-based expression proteomics, phosphoproteomics, and RPPA. (B) The number of proteins quantified by MS-based expression proteomics. (C) The number of phosphosites quantified by MS-based phosphoproteomics. (D) Phosphorylation levels of EIF4B and MELK were measured by MS-based phosphoproteomics across six control, four sensitive, and eight resistant KEP tumors. Phosphosites for some tumors were not available due to the limited dynamic range of MS. One-way ANOVA and Tukey’s post-hoc tests were performed to compute adjusted P value (*P < 0.05; **P < 0.01; n.s, not significant). (E) Western blots for EIF4B, MELK, and their phosphosites on KEP2.E3 cells transduced with lentiviral overexpression vectors for GFP, Eif4b, its phosphomimetic (S406D and S422D) and non-phosphorylatable mutants (S406A and S422A), Melk, or its non-phosphorylatable mutant (S150A). Data represent one experiment of two independent experiments. (F) Dose–response curves of KEP2.E3 cells expressing indicated Eif4b or Melk variants, treated with AZD8055 for 3 d, and assayed using CellTiter-Blue reagent. Data are represented as mean ± standard deviation of five replicas per group of two independent experiments. (G) Expression of genes present in Chr-2 amplicon identified in several resistant KEP tumors. Log2(CPM) values were transformed to Z-scores. Data are shown for 9 control, 10 sensitive, and 14 resistant KEP tumors. (H) GOBPs significantly enriched for the Chr-2 amplicon genes.

