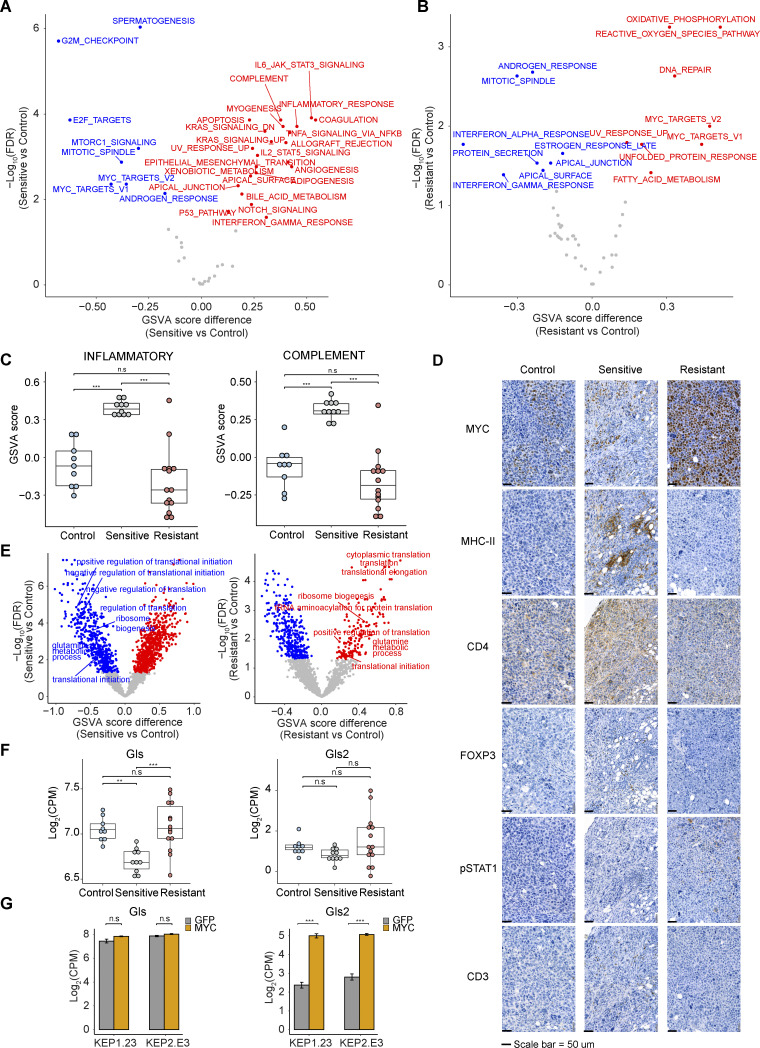
Figure S2.
Biological processes differentially regulated in different KEP tumor groups. (A and B) GSVA analysis for sensitive versus control (A) and resistant versus control (B) tumors using RNA-seq data. GSVA scores were compared using Student’s t test. Red and blue dots, significantly (FDR < 0.05) up- and downregulated in resistant tumors. (C) GSVA scores for immune-related gene sets (INFLAMMATORY, COMPLEMENT) across 9 control, 10 sensitive, and 14 resistant KEP tumors. Data are represented as median ± IQR (box) and quartiles ± 1.5 × IQR (whiskers), and one-way ANOVA and Tukey’s post-hoc test were performed to compute adjusted P values. (D) Representative IHC staining of MYC and diverse immune cell markers across different KEP tumor groups. Scale bars, 50 μm. (E) GSVA analysis for sensitive versus control tumors (left) and resistant versus control tumors (right) using RNA-seq data based on GOBP gene sets. GSVA scores were compared using the Student’s t test. Red and blue dots, significantly (FDR < 0.05) up- and downregulated in sensitive tumors (left) and resistant tumors (right). Translation- and glutamine metabolism–associated gene sets are shown in the graph. (F and G) Expression (log2(CPM)) of glutaminolysis enzymes Gls and Gls2 across different KEP tumor groups (n = 9, 10, and 14 for control, sensitive, and resistant tumors, respectively; F) and KEP cell lines expressing GFP or Myc (two replica per group; G). In C and F, data are represented as median ± IQR (box) and quartiles ± 1.5 × IQR (whiskers), and one-way ANOVA and Tukey’s post-hoc test were performed to compute adjusted P values (**P < 0.01; ***P < 0.001; n.s, not significant).

