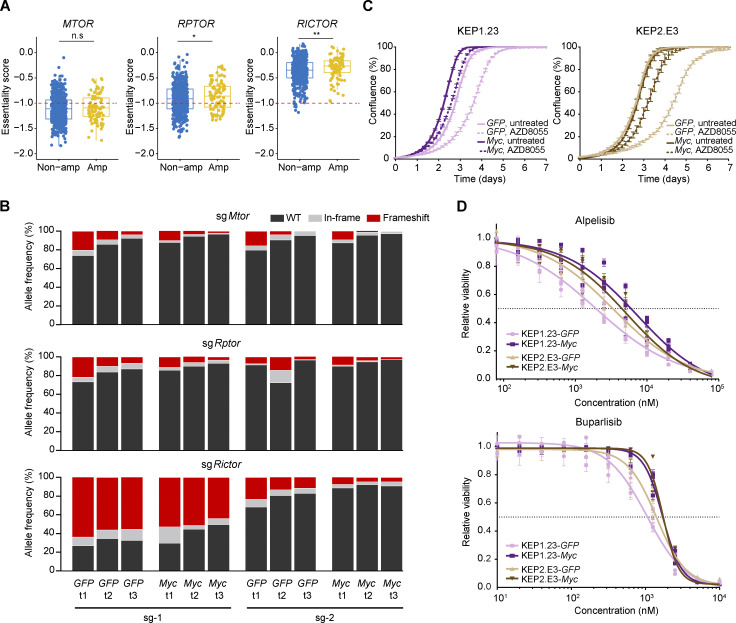
Figure S3.
Associations of MYC status versus response to PI3K/mTOR inhibition. (A) Comparison of MTOR, RPTOR, and RICTOR gene essentiality scores of cancer cell lines with and without MYC amplifications. Scores and copy number data were obtained from the DepMap (CRISPR, Public 22Q1) and the Cell Model Passports (Tsherniak et al., 2017; van der Meer et al., 2019) database, respectively. Red dotted line (−1) indicates the average gene essentiality scores of known essential genes. Data are represented as median ± IQR (box) and quartiles ± 1.5 × IQR (whiskers) and P values were computed with one-tailed Student’s t tests (*P < 0.05; **P < 0.01; n.s, not significant). (B) KEP1.23 cells overexpressing GFP or Myc were transfected with lentiCRISPRv2-sgRNA-Cas9-Blast vectors containing the indicated sgRNAs targeting Mtor, Rptor, or Rictor and selected with blasticidin. At days 2 (t1), 4 (t2), and 6 (t3) after blasticidin selection, cells were lysed and allele frequencies for the indicated genes were determined using TIDE (Brinkman et al., 2014). (C) Incucyte Live-Cell proliferation assay of KEP cell lines overexpressing GFP or Myc and treated with vehicle or 25 nM AZD8055 for 7 d. Data are represented as mean ± SEM of three replica per group of two independent experiments. (D) Dose–response curves of KEP cell lines overexpressing GFP or MYC, treated with alpelisib or buparlisib for 3 d, and measured by SRB colorimetric assay. Data are represented as mean ± standard deviation of five technical replicas per group of three independent experiments.

