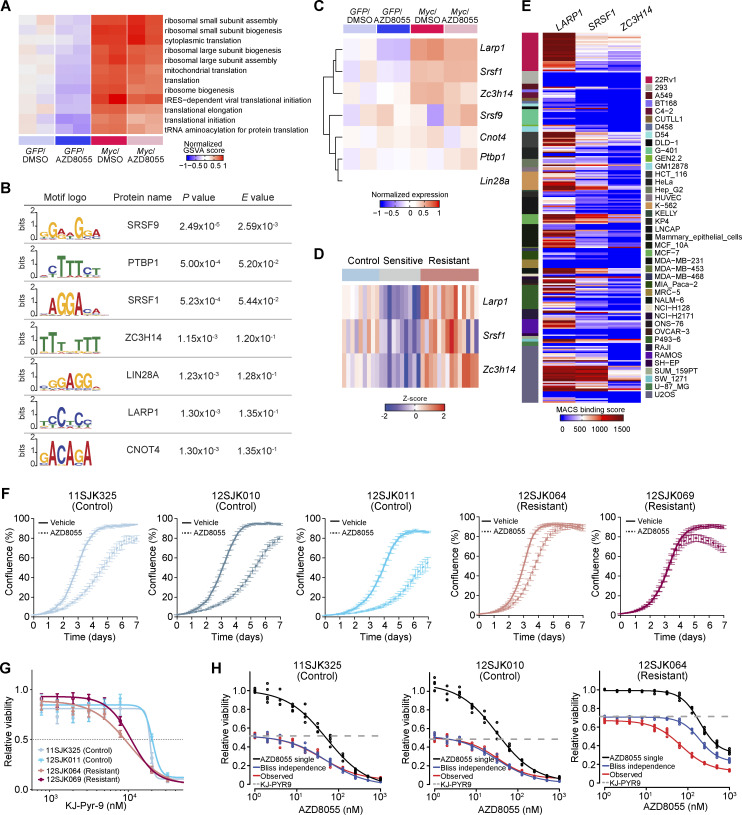
Figure S5.
RNA-binding proteins associated with MYC-driven translation regulation. (A) Normalized GSVA scores (centered on the mean of control GFP/DMSO samples) for translation and ribosome-associated processes in GOBPs computed based on the RNA-seq profiles of GFP and Myc-overexpressing KEP1.23 cells after DMSO or AZD8055 treatment (two replicas per condition). (B) Motifs of RNA-binding proteins that were significantly enriched in 5′-UTRs of transcripts in Myc-overexpressing KEP1.23 cells versus controls, as identified using the AME motif scanner (McLeay and Bailey, 2010). Motif logos that were P value (Wilcoxon rank-sum test) adjusted by Bonferroni correction and E-value (adjusted P value multiplied by the number of motifs) were provided by AME. (C) Gene expression of RNA-binding proteins identified in A in GFP and Myc-overexpressing KEP1.23 cells after DMSO or AZD8055 treatment (two replicas per condition). Log2(CPM) values were normalized by subtracting the mean values of GFP-DMSO samples. (D) Gene expression of the RNA-binding factors Larp1, Srsf1, and Zc3h14 across 9 control, 10 sensitive, and 14 resistant KEP tumors. Log2(CPM) values were transformed to Z-scores. (E) Model-based analysis of ChIP-seq (MACS) binding scores (−10og10Q-value) in the promoter regions (±5KB from transcription start site) of LARP1, SRSF1, and ZC3H14 obtained from the ChIP-Atlas database (Oki et al., 2018). (F) Incucyte Live-Cell proliferation assay of control and resistant KEP cultures treated with vehicle or 90 nM AZD8055 for 7 d. Data are represented as mean ± SEM of five replicas per group of two independent experiments. (G) Dose–response curves of control and resistant KEP cultures, treated with KJ-Pyr-9 for 3 d, and measured by SRB colorimetric assay. Data are represented as mean ± standard deviation of five replicas per group of two independent experiments. (H) Dose–response curves of control and resistant KEP cultures treated with an AZD8055 range and 8 μM KJ-Pyr-9 MYCi for 3 d, and measured by SRB colorimetric assay. Bliss independence model is shown to display an independent effect of KJ-Pyr-9 and AZD8055. Data are represented as mean ± standard deviation of five replicas per group of one experiment.

