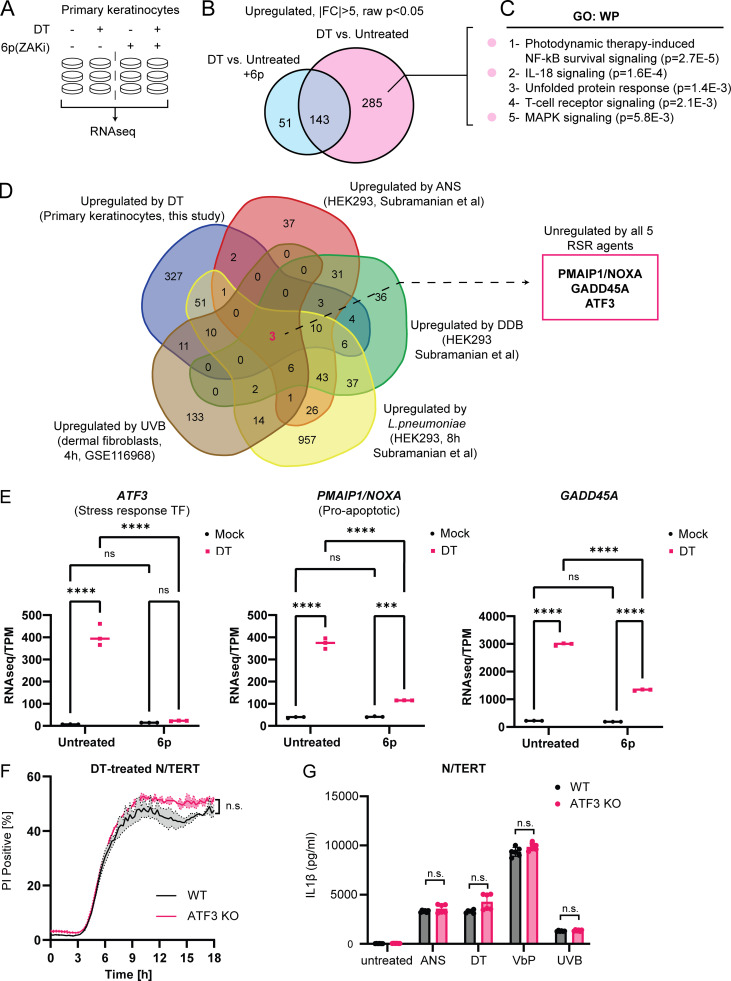
Figure 4.
Identification of transcripts that are induced by multiple RSR agents across multiple cell types. (A) Design of RNAseq experiment using primary keratinocytes. Compound 6p is a ZAKα inhibitor. (B) Venn diagram showing the identification of 285 ZAKα-dependent, DT-induced upregulated transcripts in primary keratinocytes. (C) Gene Ontology (GO) analysis of ZAKα-dependent DT-induced upregulated transcripts. (D) Venn diagram demonstrating the overlap of transcriptional changes elicited by the indicated RSR agents. The source cell types are indicated in brackets. Fold change (FC) > 2 used a cutoff for datasets published in Subramanian et al. (2022) (Preprint; DDB, ANS, and L. pneumoniae). FC > 1.5 was used as the cutoff for UVB (GEO accession: GSE116968) in accordance with the depositing authors’ analysis. (E) Transcripts per kilobase million (TPM) transcript levels of ATF3, PMAIP1/NOXA, and GADD45A in mock and DT-treated control or 6p-treated primary keratinocytes. Significance values were calculated from -way ANOVA from three biological replicates shown. ns, not significant; ****, P ≤ 0.0001. (F) Kinetics of PI uptake of primed wild-type and ATF3 KO N/TERT cells treated with DT. Significance values were calculated from Student’s t test at the 7-h time point. n.s., not significant. (G) IL-1β ELISA of control and ATF3 KO primed N/TERT cells after the drug/toxin treatments. Significance values were calculated from one way ANOVA from two biological replicates. n.s., not significant.

