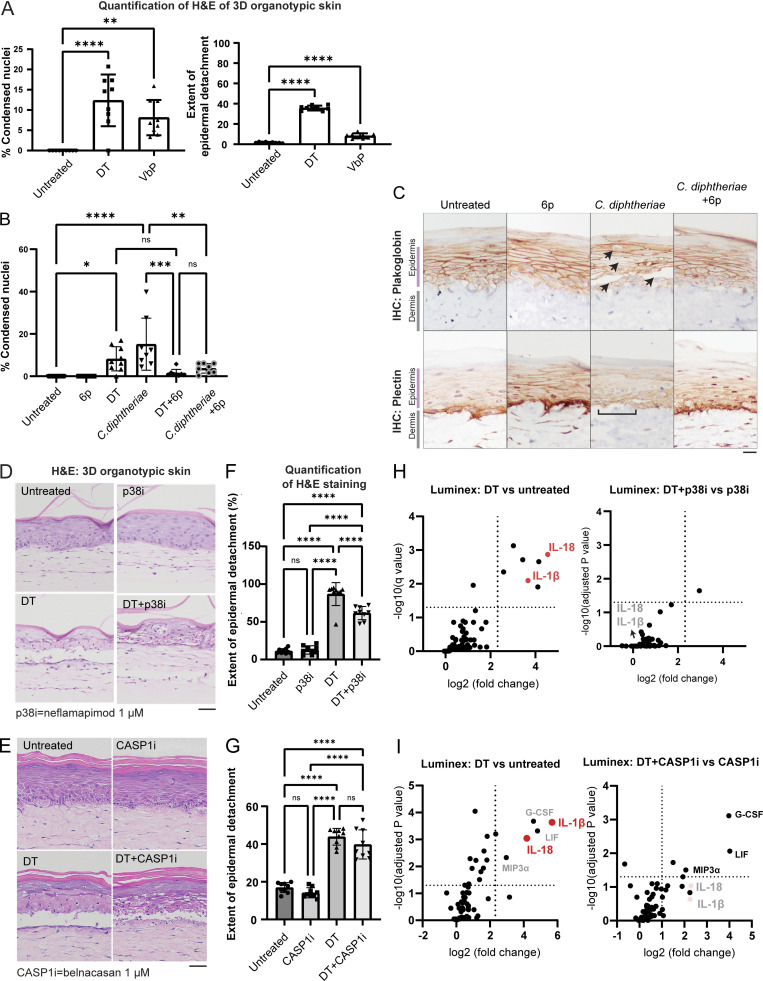
Figure S3.
Further data on C. diphtheriae–induced skin damage in 3D skin cultures. (A) Quantification of the percentage of cells with condensed nuclei and the detachment between the dermal–epidermal layer, based on the H&E staining of 3D skin. (B) Quantification of the percentage of cells with condensed nuclei based on the H&E staining of 3D skin sections shown in Fig. 5. (C) Immunohistochemistry (IHC) staining of plakoglobin (desmosome and adherens junction marker) and plectin (hemidesmosome marker) in 3D skin sections treated with the indicated conditions. Black arrows indicate foci of epidermal damage with loss of plakoglobin staining. Brackets indicate areas of DEJs with disorganized plectin staining. Scale bar = 50 µm. (D) H&E staining of 3D skin treated with DT and neflamapimod (p38i). Tissues were fixed 24 h after treatment. Scale bar = 50 µm. (E) H&E staining of 3D skin treated with DT and belnacasan (CASP1i). Tissues were fixed 24 h after treatment. Scale bar = 50 µm. (F) Quantification of the extent of the detachment between the dermal–epidermal layer based on the H&E staining of p38i-treated organotypic skin samples. (G) Quantification of the extent of the detachment between the dermal–epidermal layer based on the H&E staining of CASP1i-treated organotypic skin samples. (H) Significantly upregulated cytokines/chemokines in the indicated organotypic skin samples. Log10(adjusted P value) and log2(fold change) were calculated from a multiparametric t test. The samples correspond to D and F. Media from organotypic skin collected 24 h after treatment with DT and the inhibitors. (I) Significantly upregulated cytokines/chemokines in the indicated organotypic skin samples. Log10(adjusted P value) and log2(fold change) were calculated from a multiparametric t test. The samples correspond to E and G. Media from organotypic skin were collected 24 h after treatment with DT and the inhibitors. ns, not significant; *, P ≤ 0.05; **, P ≤ 0.01; ***, P ≤ 0.001; ****, P ≤ 0.0001.

