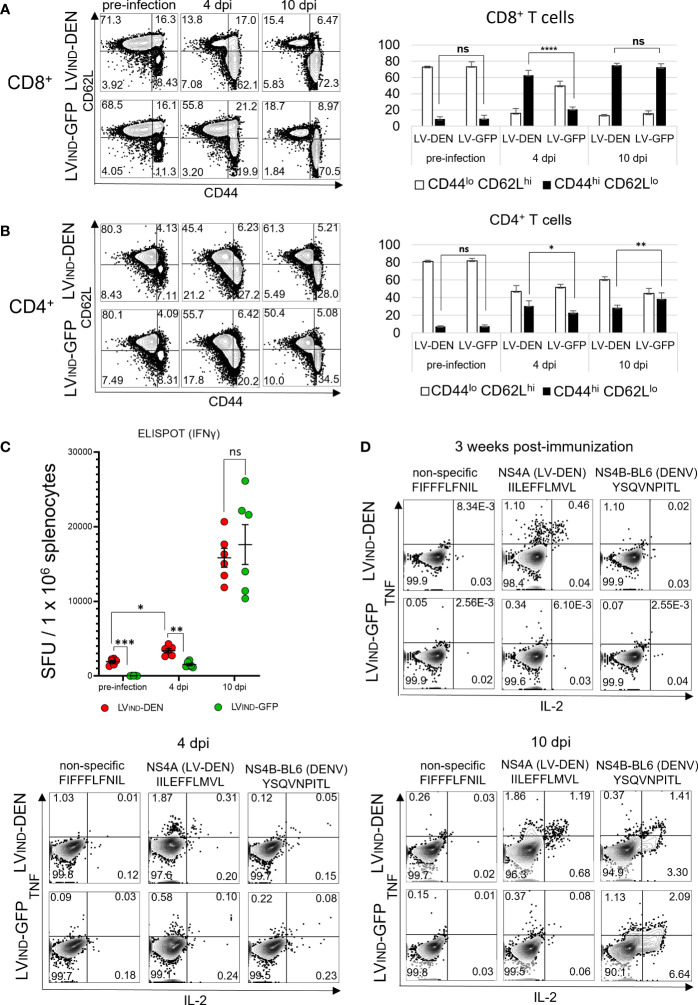
Figure 8.
T-cell status in LV-DEN-vaccinated mice, before and after DENV-2 challenge. IFNAR-BL6 mice (n = 6/group) received i.m. injection of LVIND-DEN or LVIND-GFP and 1 month later were challenged i.v. with 2 × 10⁶ FFU/mouse of DENV-2. Expression of CD44 and CD62L markers by CD8+ (A) or CD4+ (B) T cells, collected before and after the challenge. Cytometry was performed on splenocytes of all individual mice (n = 6/group) and figures of one representative animal from each group are shown. Gating on (A) CD8+ (left panel) and (B) CD4+ (left panel) cells to identify populations of naive (CD44lo CD62Lhi) or activated (CD44hi CD62Llo) T cells. Percentage of naive or activated cells versus (A) CD8+ (right panel) and (B) CD4+ (right panel) T cells before and after the challenge. Figures show mean counts from each group of animals (n = 6). Statistical significance of differences between groups of T cells expressing the selected markers was determined by a one-way ordinary ANOVA test with Tukey corrections for multiple comparisons (ns, non-significant, * p < 0.05, ** p < 0.01, and **** p < 0.0001). (C) Frequencies of IFNγ+ T splenocytes at day 21 post-immunization before the challenge and at 4 and 10 dpi, analyzed by IFNγ ELISPOT. Splenocytes of individual mice were re-stimulated with a peptide pool composed of seven peptides: six that were included in the DEN poly-antigen and one DENV-specific peptide that was not included in the DEN poly-antigen but was used for re-stimulation to take into account non-vaccine specific response to DENV infection ( Table S1 ). Statistical significance of the differences between groups was evaluated by one-way Welch ANOVA test with Dunnett’s T3 corrections for multiple comparisons (ns, non-significant, * p < 0.05, ** p < 0.01, and *** p < 0.001). (D) ICS for TNF and IL-2 was performed on pooled CD8+ T splenocytes (n = 6/group) stimulated with individual peptides.

