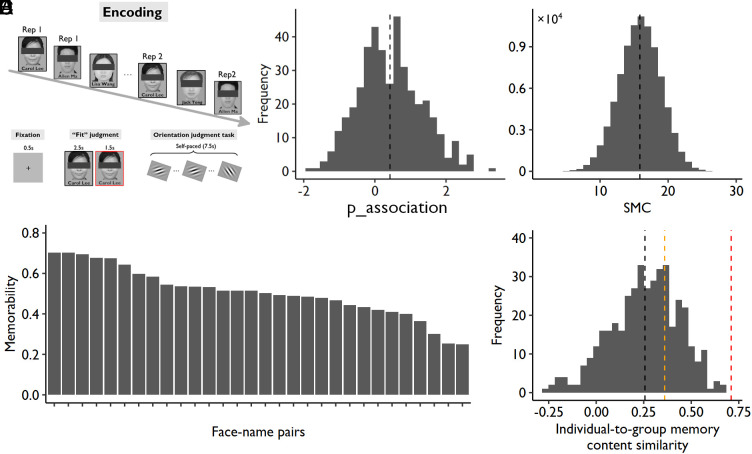
Fig. 1.
Experimental design and behavioral results of Exp 1. (A) Experimental design of the face–name associative memory task. (B) Distribution of memory ability (i.e., p_association, associative recognition rate); the black vertical dotted line represents the mean of all participants. (C) Distribution of the SMC; the black vertical dotted line represents the mean of all participant pairs. (D) The averaged memory performance across participants (i.e., memorability) of each face–name pair (30 pairs in total). (E) The distribution of correlations between each individual’s memory profile and the group-averaged profile (i.e., memorability); the black dotted line represents the mean correlation across participants (i.e., R = 0.26); the orange dotted line represents the correlation coefficient that is statistically significant at P < 0.05 (i.e., R = 0.36); the red dotted line represents the correlation coefficient that explains 50% of the variance (i.e., R = 0.71).

