Fig. 4.
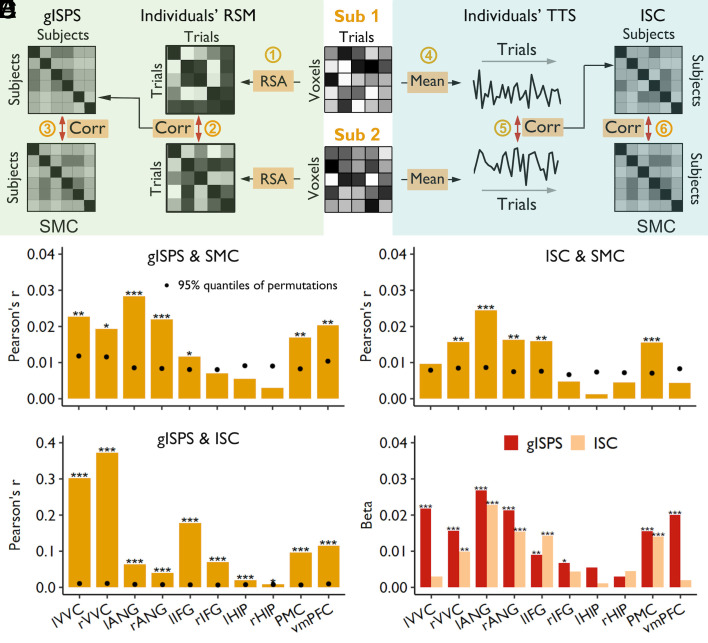
Intersubject similarity in representations and activities predicted SMC. (A) Schematic diagram depicting the calculation of gISPS and intersubject correlation (ISC) in TTS and their correlations with the SMC. To examine the relationship between gISPS and SMC (Left), we first performed representational similarity analysis (RSA) across all trials to generate an RSM for each participant (Step 1). The resultant individuals’ RSMs were then used to calculate cross-subject correlations to obtain gISPS (Step 2). Finally, the relationship between gISPS and SMC was examined by using the Mantel test (Step 3). To examine the relationship between ISC and SMC (Right), we first averaged the activity across all voxels within an ROI to generate TTS for each participant (Step 4). We then calculated cross-subject correlations of neural fluctuation by using the resultant individuals’ TTSs to obtain ISC (Step 5). Finally, the correlation between ISC and SMC was calculated by using the Mantel test (Step 6). Corr, correlation. (B) The gISPS in most ROIs, including the bilateral VVC and ANG, left IFG, PMC, and vmPFC, was significantly correlated with SMC. (C) The ISC in the right VVC, bilateral ANG, left IFG, and PMC was significantly correlated with SMC. (D) The gISPS was significantly correlated with ISC. *PHolm < 0.05, **PHolm < 0.01, ***PHolm < 0.001. The black dots represent 95% quantiles of permutations; thus, the black dot within a bar means the significant effect for the Mantel test. (E) The unique contribution of gISPS and ISC to SMCs in bilateral ANG, right VVC, left IFG, and PMC; *P < 0.05, **P < 0.01, ***P < 0.001. lVVC, left ventral visual cortex; rVVC, right ventral visual cortex; lANG, left angular gyrus; rANG, right angular gyrus; lIFG, left inferior frontal gyrus; rIFG, right inferior frontal gyrus; lHIP, left hippocampus; rHIP, right hippocampus; PMC, posterior medial cortex; vmPFC, ventromedial prefrontal cortex.

