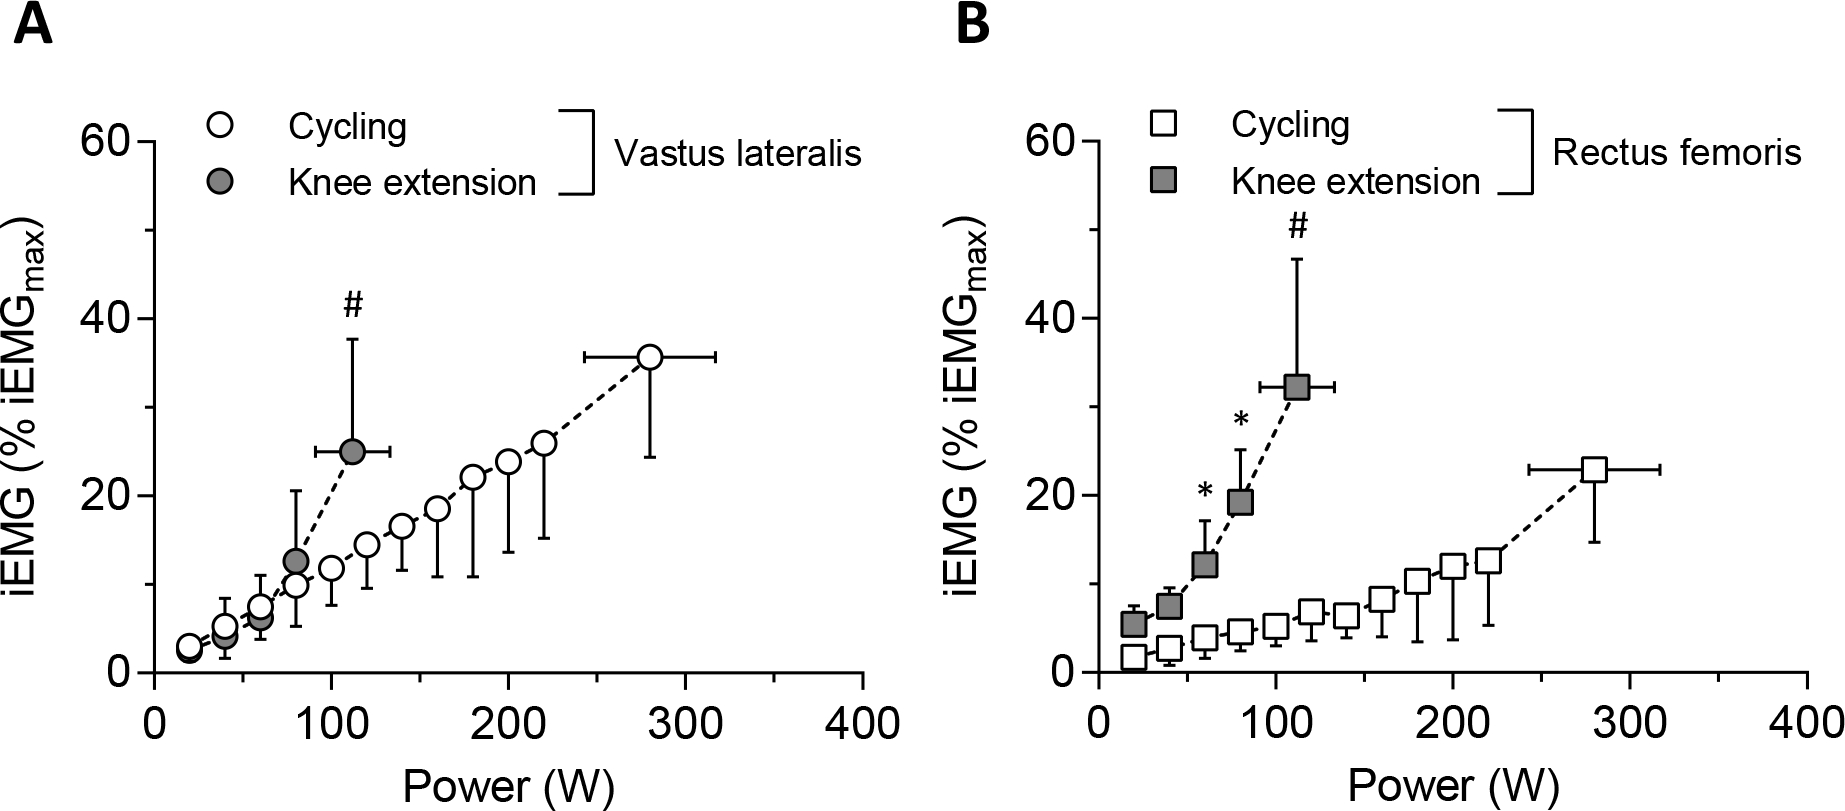
Figure 2.

Mean normalized muscle activation patterns across absolute power output in each muscle site (A, vastus lateralis [VL]; B, rectus femoris [RF]). * showed the significant differences between exercise modes at the same absolute power output (P < 0.05). # showed the significant differences between exercise modes at maximal power output (P < 0.05).
