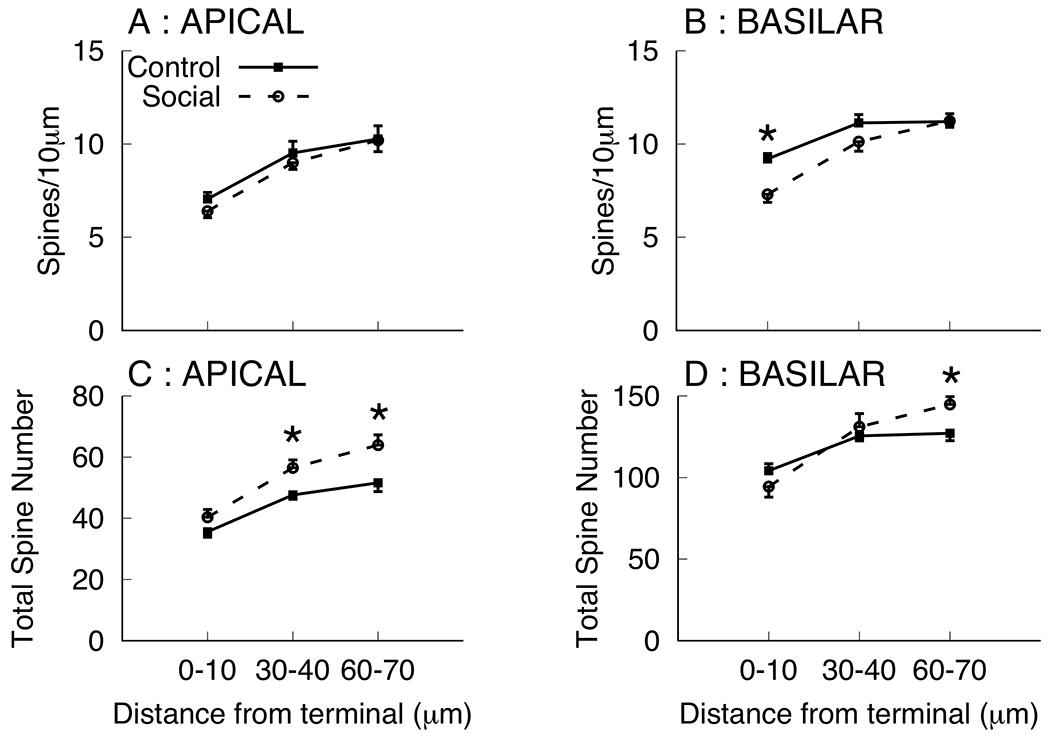
Figure 3.

Mean spine density per 10μm (A, B) and total spine number (C, D) in dendritic segments 0-10, 30-40, and 60-70 μm from the terminal tip on third order branches in apical (A, C) and basilar (B, D) dendritic fields for the control and social groups of Experiment 1. Total spine numbers were calculated as the product of the total number of third order branches and mean spine number per segment. * p < 0.05.
