
FIGURE 1.
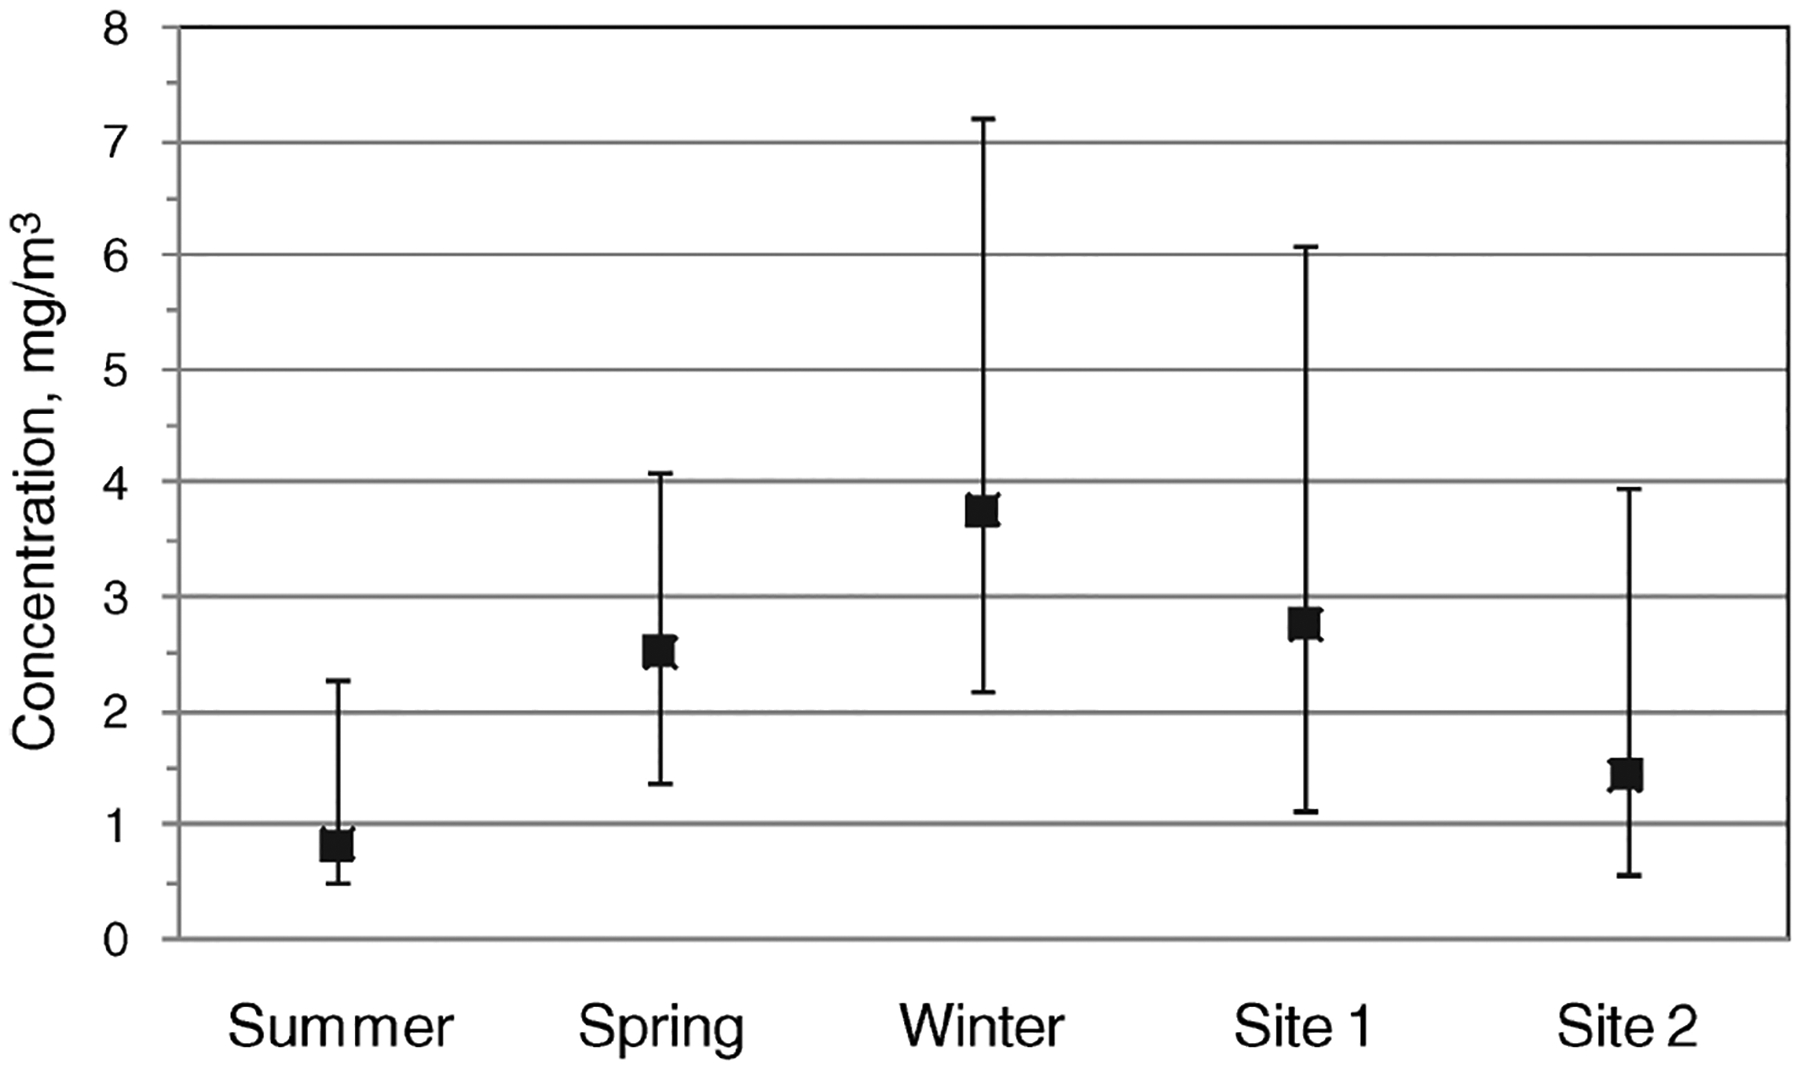
Inhalable concentrations measured for each subject separated by three seasons and two sites. Error bars indicate the 10% and 90% percentile values of the lognormally distributed concentration values for each sample set.
Official websites use .gov
A
.gov website belongs to an official
government organization in the United States.
Secure .gov websites use HTTPS
A lock (
) or https:// means you've safely
connected to the .gov website. Share sensitive
information only on official, secure websites.
Inhalable concentrations measured for each subject separated by three seasons and two sites. Error bars indicate the 10% and 90% percentile values of the lognormally distributed concentration values for each sample set.