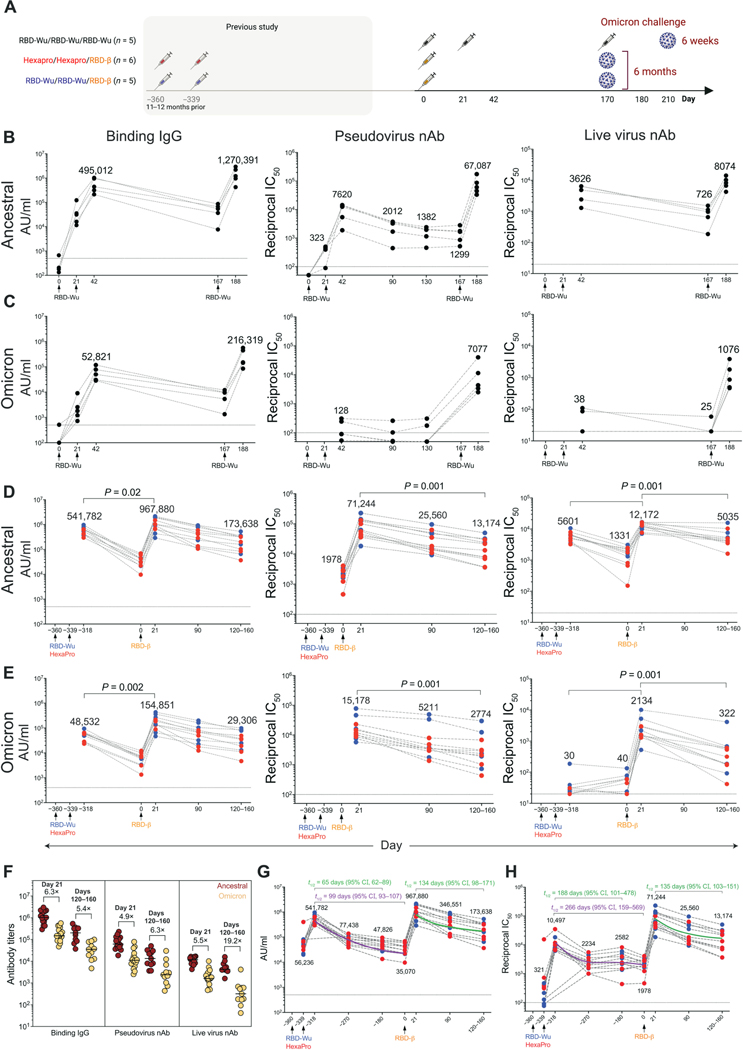
Fig. 1. AS03-adjuvanted RBD-I53–50 immunization elicits potent and durable serum antibody responses.
(A) Schematic of the study design is shown. (B and C) Anti–Spike protein binding IgG, pseudovirus, and live virus nAb titers were measured against ancestral (B), and Omicron (C) strains in the RBD-Wu/RBD-Wu/RBD-Wu group (n = 5). (D and E) Binding IgG, pseudovirus, and live virus nAb titers were measured against ancestral (D) and Omicron (E) strains in the RBD-Wu/RBD-Wu/RBD-β (blue, n = 5) and HexaPro/HexaPro/RBD-β (red, n = 6) groups. The numbers within the graphs show GMTs. (F) Antibody titers against ancestral and Omicron strains are shown at the time points (n = 16 and 11 on day 21 and days 120 to 160, respectively) indicated on top. The numbers indicate fold change between ancestral and Omicron titers. Horizontal bars indicate median. (G and H) Binding (G) and pseudovirus nAb (H) titers were measured against the ancestral strain in serum collected at indicated time points (n = 11; n = 9 or 10 on day −318, 21 days after the second vaccination). The purple (calculated using four data points) and green (calculated using three data points) lines show the fit using the power law model to calculate decay rates. The data in (F) to (H) contain a portion of the data from (B) to (E). The statistical differences between time points were determined using Wilcoxon matched-pairs signed rank test. Horizontal dashed lines throughout indicate the lower limit of quantitation.

