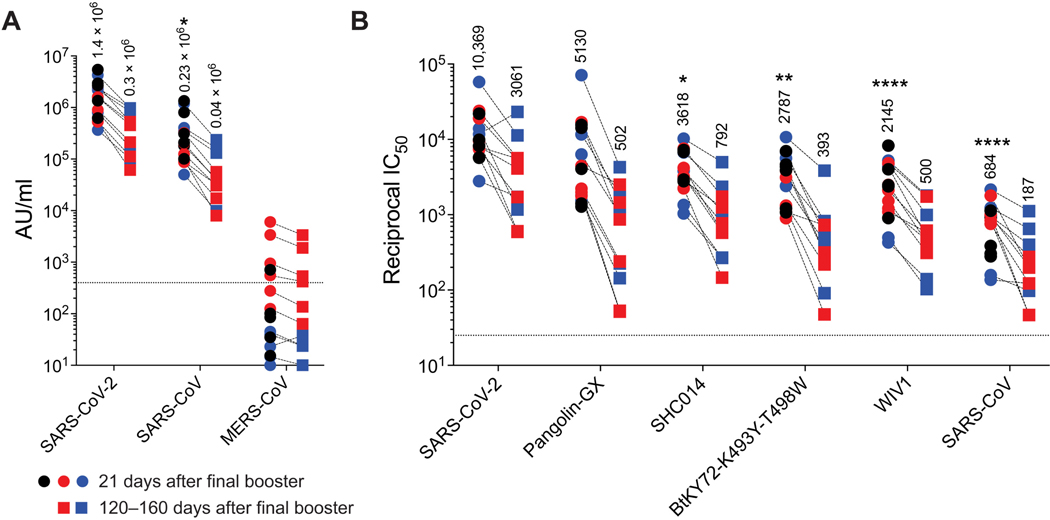
Fig. 2. A second booster immunization with RBD-Wu + AS03 or RBD-β + AS03 promotes broadly nAb responses.
(A) Binding IgG responses are shown against Spike protein from viruses indicated on the x axis. (B) Pseudovirus nAb responses against viruses indicated on X-axis are shown. Each symbol represents an animal [RBD-Wu/RBD-Wu/RBD-Wu (black; n = 5), RBD-Wu/RBD-Wu/RBD-β (blue; n = 5), and HexaPro/HexaPro/RBD-β (red; n = 6)], and paired samples are connected with a dashed line. The numbers within the graphs show GMTs. The statistical differences between viruses in were calculated using Friedman test for paired samples (*P < 0.05, **P < 0.01, and ****P < 0.0001). The horizontal dashed lines indicate the lower limit of quantitation.

